I didn't plan to post about $HIVE and the market in general, but the latest events deserve a word I believe.
To cut a long story short, this is what I said yesterday, in my technical analysis:
The daily chart shows clearly price swept the low of the candle marked on my chart and the next obvious liquidity pool is at the relative equal lows, which lay within the daily order block (OB D), which is meant to defend price. It's a crucial level that should hold as otherwise things could get ugly, we could revisit the $0.15 area, or even lower. $HIVE Technical Analysis - 04.08.2024
Unfortunately, today 💩 hit the fan and the worst happened.
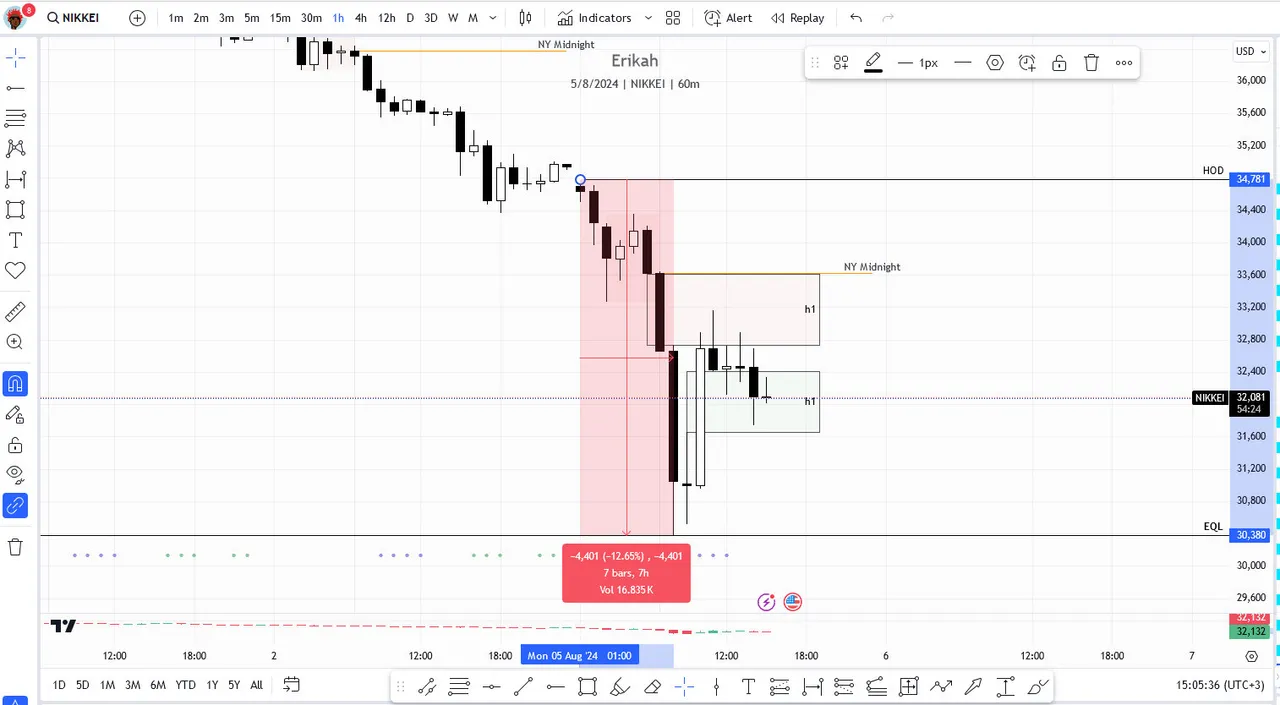
NIKKEI started the day on the wrong foot, started dropping and registered a 12% drop in 8 hours.
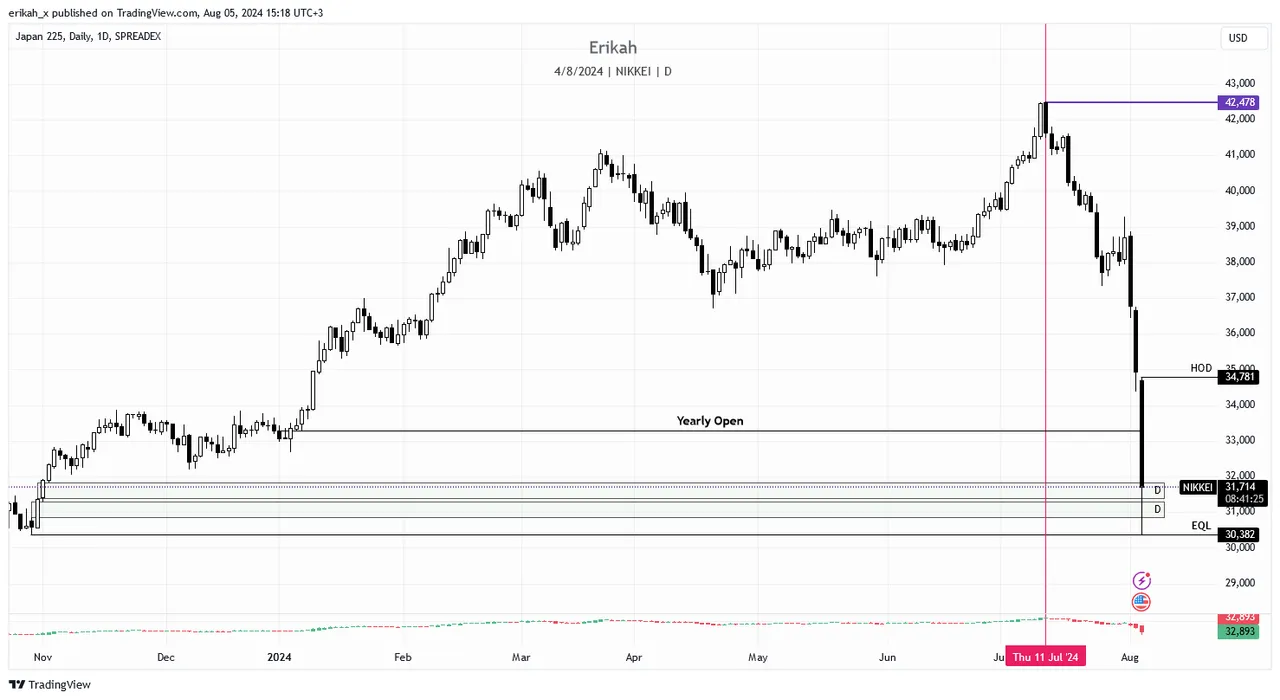
NIKKEI is not the focus on my analysis, but it worth to mention, that unfortunately, today NIKKEI dropped below the yearly open and cancelled all the yearly gain in less that 4 weeks. There has been signs as you can see and the inevitable happened today.
Unfortunately, as I mentioned yesterday, these events have a huge impact on most of the markets. Major stocks dropped 10 - 12% and risk assets like crypto were impacted as well.
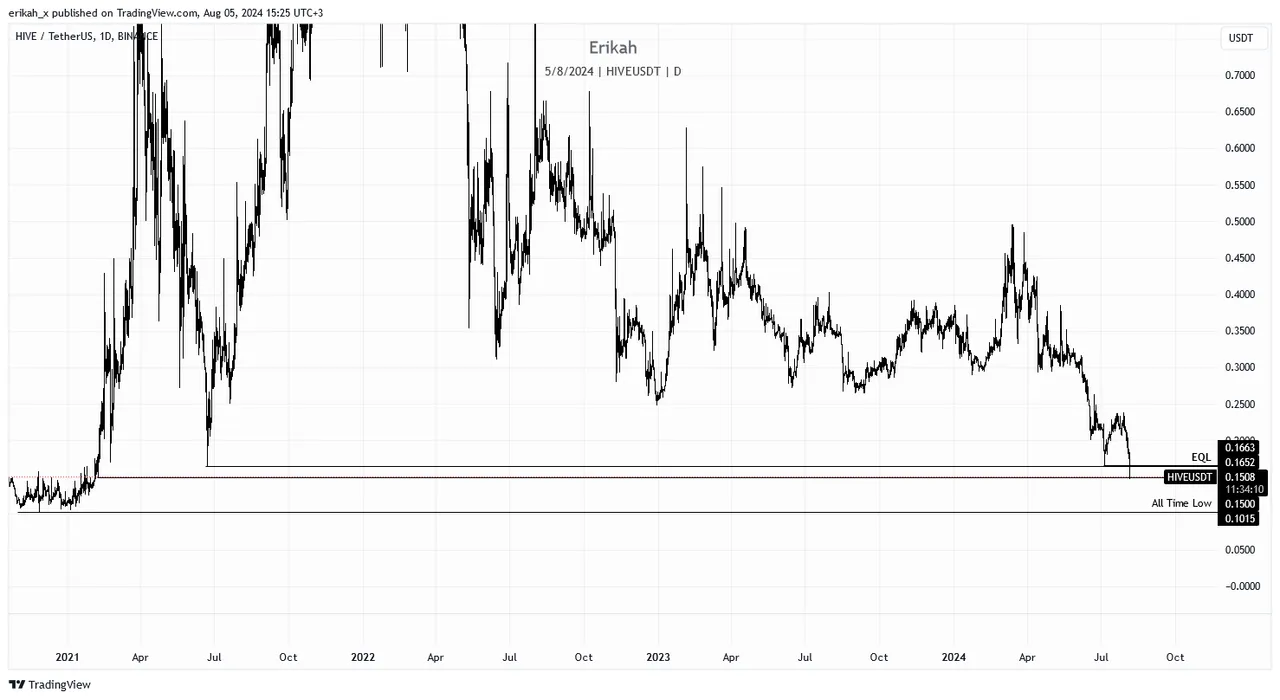
On the daily chart, $HIVE swept the two lows I mentioned as relative equal lows and swept $0.15 as well. This chart is a bit messy, as I wanted to show where the $0.15 level is coming from, but bear with me as the next chart is more clear.
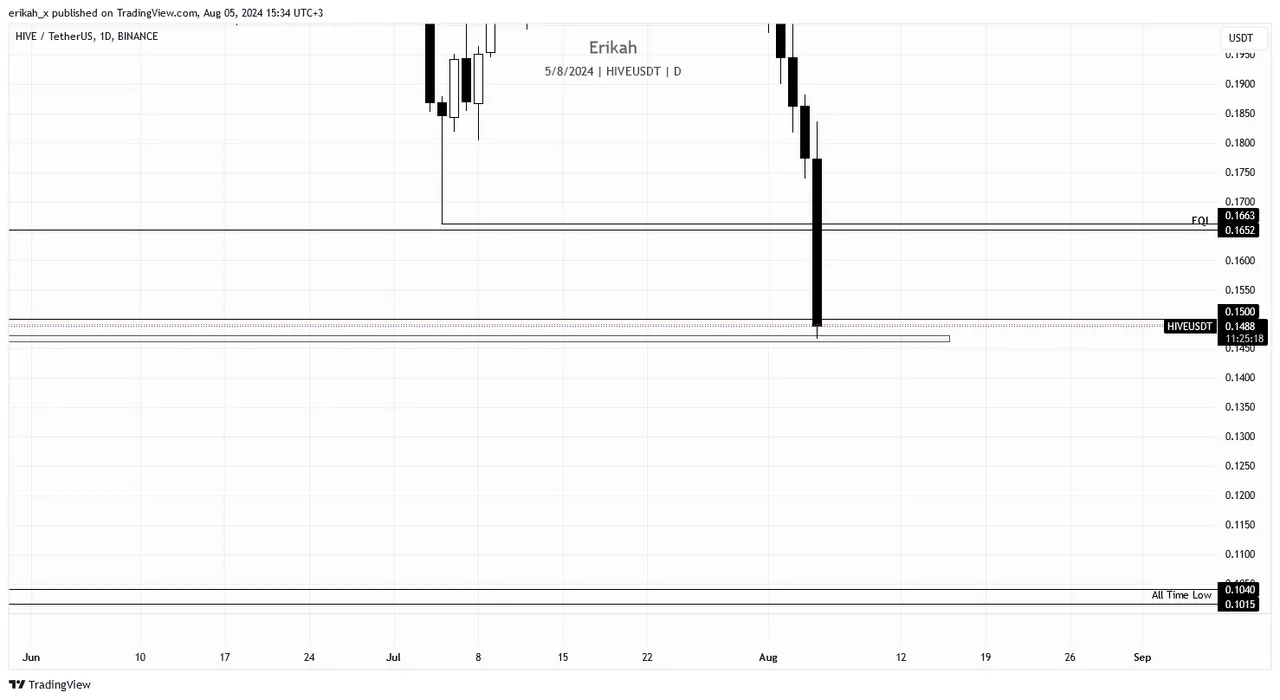
At the time of writing, on a daily scale, price bounced off a bullish fair value gap (FVG), which is defending price at the moment, but if that FVG will not hold, things can get really ugly for $HIVE.
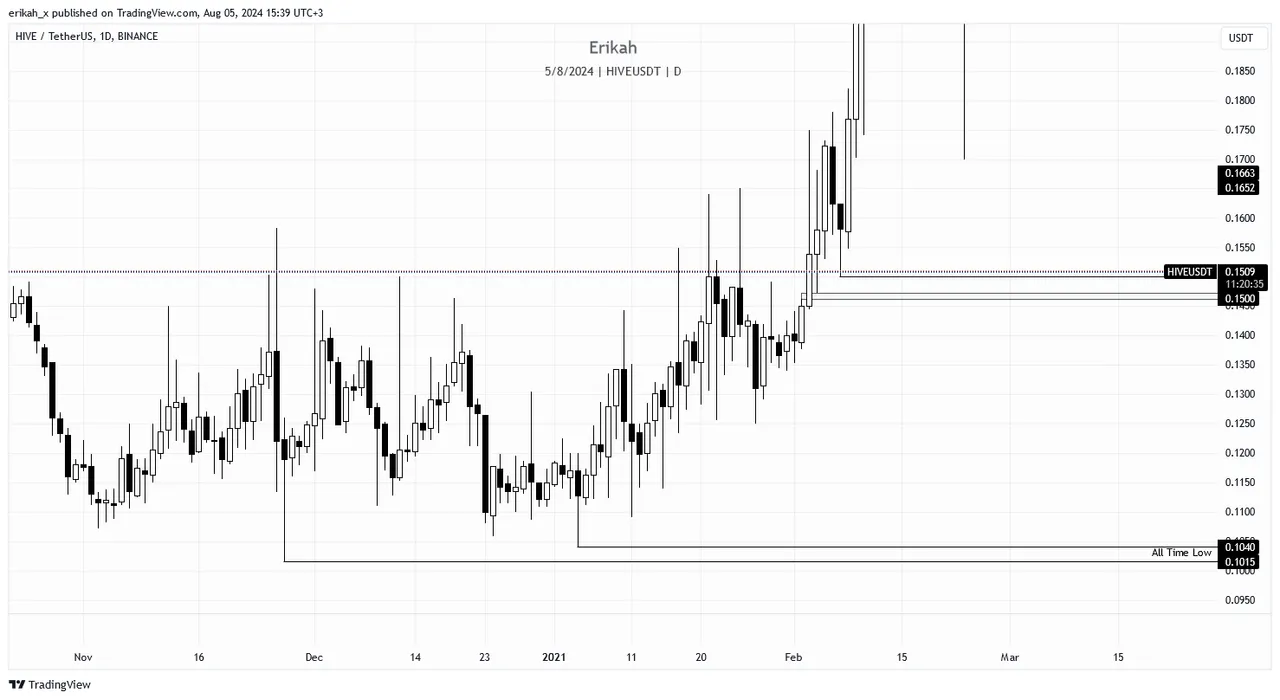
This is the left side of the chart and as you can see, that bullish FVG, marked with green, is the last one to defend price. If that is lost, below we only have low resistance liquidity. Could we revisit those levels at $0.1? Who knows? Everything is possible. The chart clearly shows, but for those who are not familiar with reading candle charts, we're at the February 2021 levels with $HIVE.

On a more granular scale, the h4 chart is not more promising either, if you want to see a sharp upside move. The current candle closes in 3 hours and right now it looks like a bearish one. There's a huge bearish FVG (marked with red) above, which is capping the market right now. For bullish continuation, price needs to close above the FVG, invert it and also close above the orange line at $0.1818, which is the bullish order bloc (OB) right now. To give you an idea, when it's going to happen, that would be a 21% move to the upside, which most likely won't happen in a day, unless someone with deep pockets throws in a big order. I'd like to be proven wrong here as we've seen crazy wicks in the past and this is the time to buy or at least DCA in, but time will tell. If not, we're going to climb up gradually.
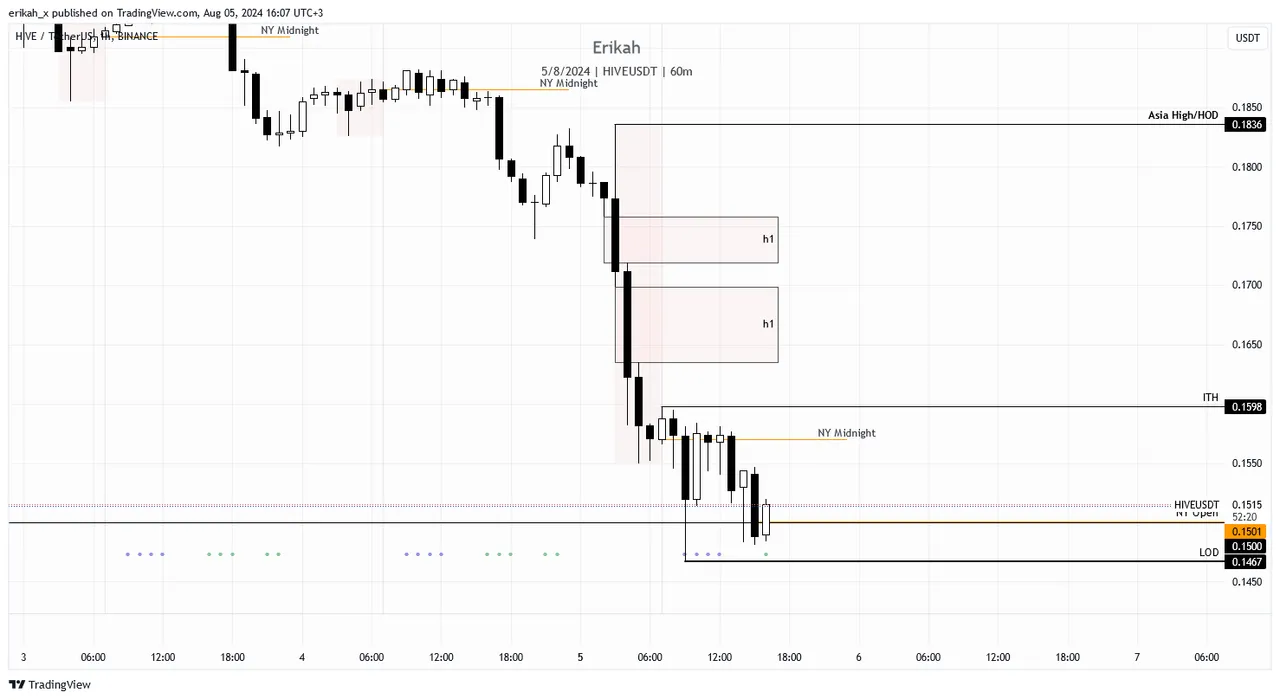
On the hourly, things look a bit better, but we're far from being out of the woods. The current candle is bullish right now, but at the time of writing, there are still 50 minutes to the candle close, price is above NY open, but we have ISM Services PMI news in 50 minutes, which again, can move the market in both directions. At this point, a sweep of the current low at $0.1467 is still possible.

$BTC is not looking better either. The CME gap was fulled and price dropped like a stone during Asia and London. Price seems heavy at the moment and on the h12 chart, the sweep of low of day (LOD) seems very likely. News can work as catalyst. If LOD is lost, a sweep of $48300 is possible. Below that level we have two bullish FVGs, that should defend price, but $44k is also in the cards. I'm not saying it's going to happen, but it's better to be prepared because if that happens, alts will be murdered.
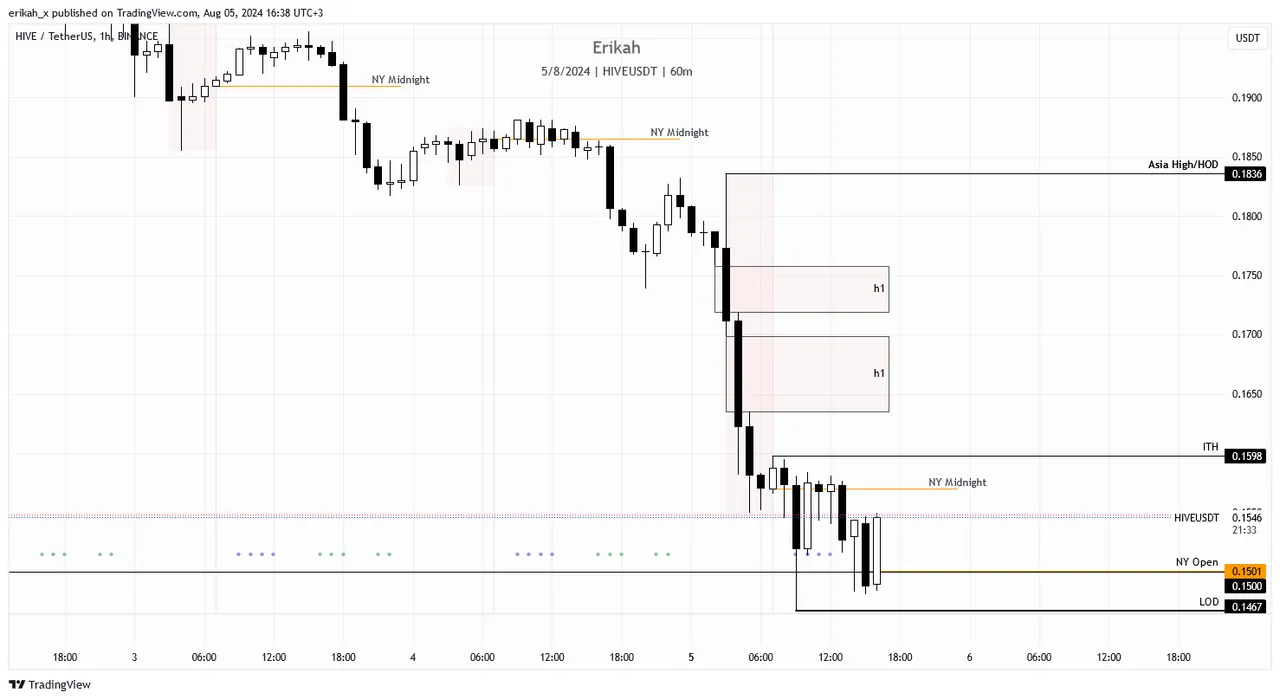
UPDATE: while I've been writing my post, the hourly candle became bigger, which means price is seeking liquidity higher. Let's see if it can close as a bullish engulfing candle. But again, watch out for the news in about 18 minutes and most importantly, stay safe!
As always, this is a game of probabilities, not certainties. Also please note, this is not financial advice, it's my view and understanding of the market.
All charts posted here are screenshots from Tradinview.

If you're a newbie, you may want to check out these guides:
- Communities Explained - Newbie Guide
- Cross Posting And Reposting Explained, Using PeakD
- Hive Is Not For Me
- How To Pump Your Reputation Fast - Newbie Guide
- Tips And Tricks & Useful Hive Tools For Newbies
- More Useful Tools On Hive - Newbie Guide
- Community List And Why It Is Important To Post In The Right Community
- Witnesses And Proposals Explained - Newbie Guide
- To Stake, Or Not To Stake - Newbie Guide
- Tags And Tagging - Newbie Guide
- Newbie Expectations And Reality
- About Dust Vote And Hive Reward Pool, by libertycrypto27