Repository
https://github.com/iSoron/uhabits
Components
My suggestion is for the installation of piechart feature on Loop - Habit Tracker Mobile application.
As Loop helps to create and maintain good habits, while allowing its user to achieve long-term goals.
- The application can be downloaded here
Proposals
Pie chart is a circular statistical graphic which is divided into slices to illustrate numerical proportion. Pie chart on Loop - Habits Tracker Mobile application should be created in a way that it will be easy to track and view overall habits of a user or selected habits.
Currently on Loop - Habits Tracker Mobile application, there is only an option to track an individual habits individually. This make it a little bit difficult to monitor a change in habit simultaneously.
Been an application created to maintain good habits, then there will be a need for an individual to have an overall view of all their habit in a pie chart, so as to make it easy to view and track overall habits.
Mockups / Examples
Below is an image example that illustrate, how the pie chart features can be installed.

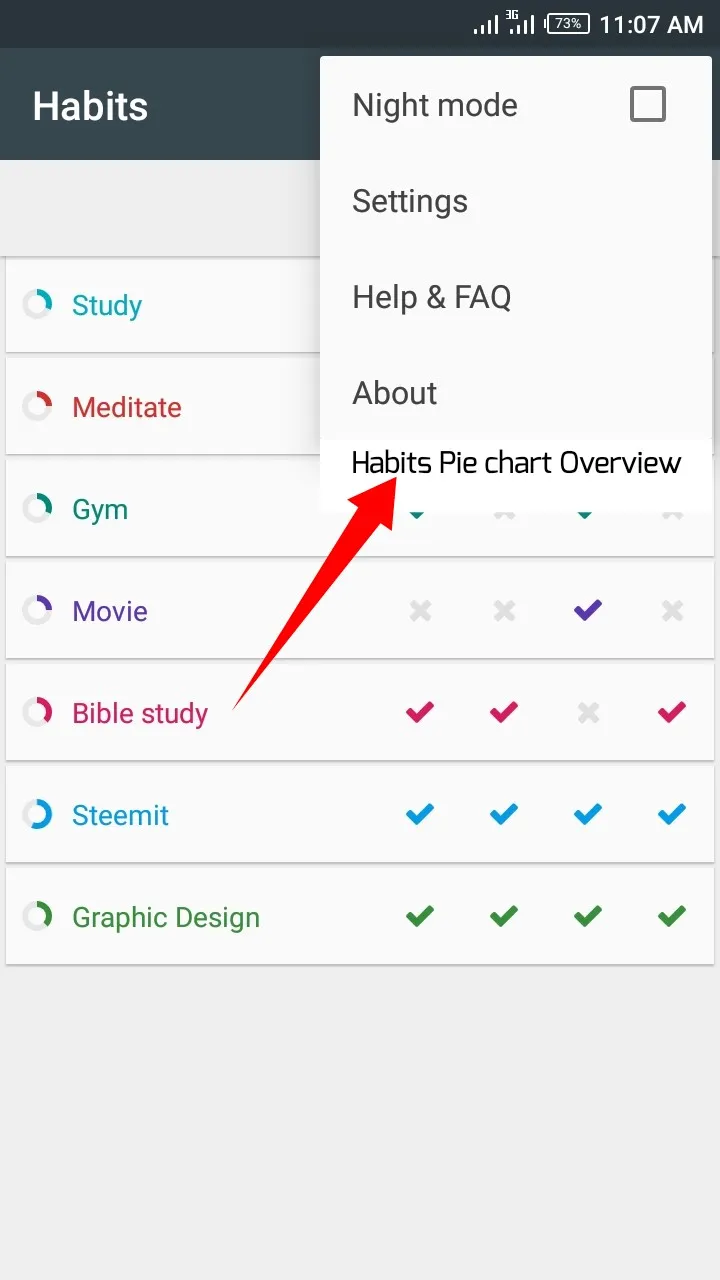
The image above shows that an extra row can be made on the menu tab so as to include option to select habits pie chart overview features.

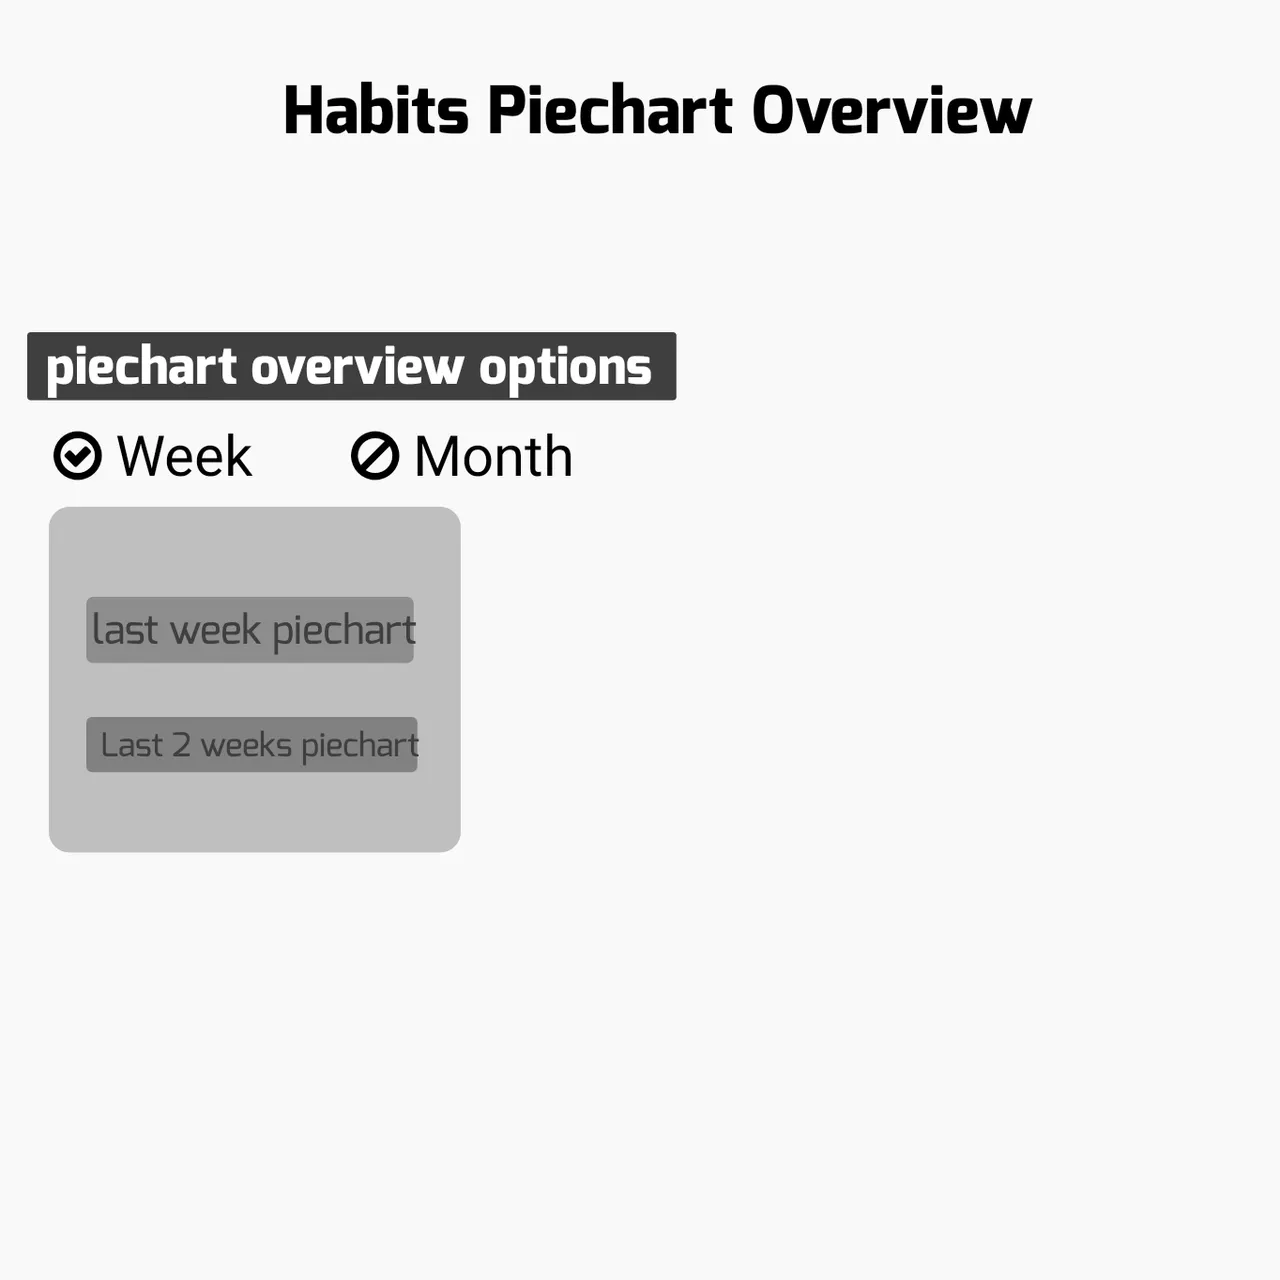
The image above shows Habit Pie Chart overview page with option to select pie chart for either months or weeks.

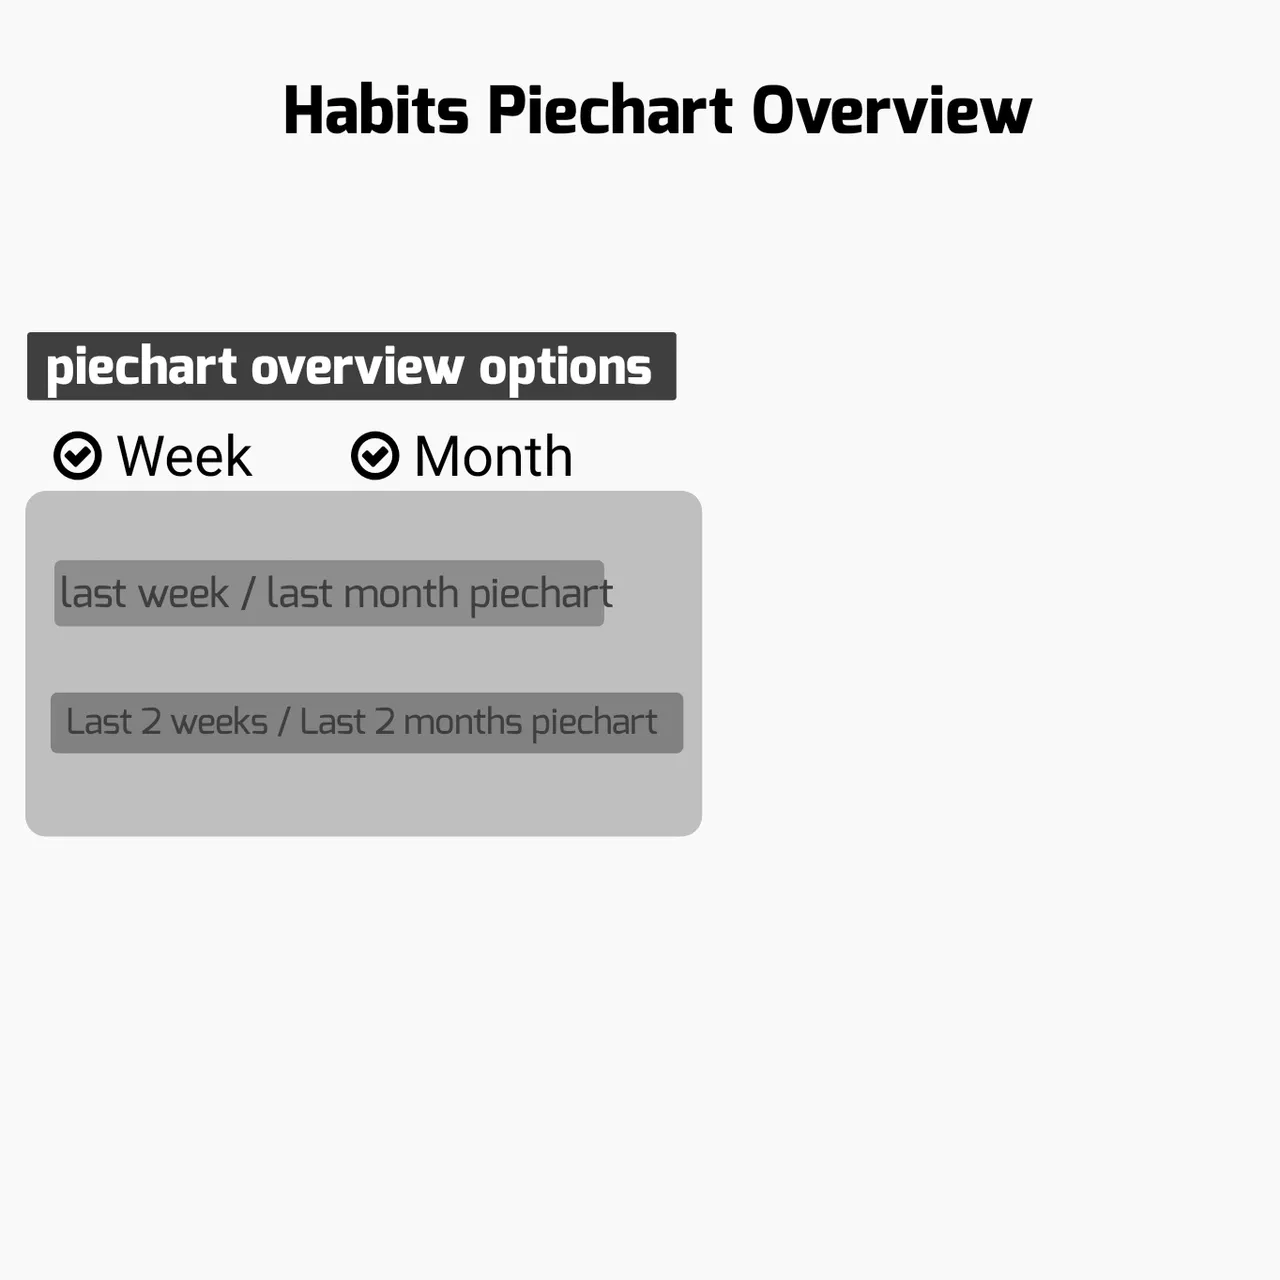
The image above show that pie chart for both last week and last month where selected.

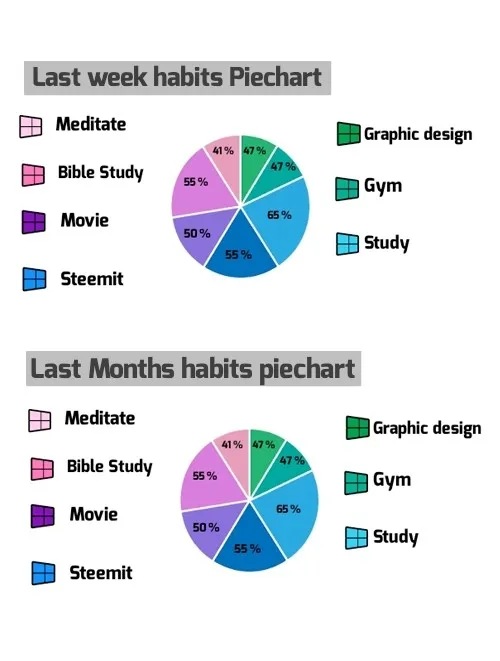
The image above show a pie chart habits overview for both last week and last month.
Benefits
This kind of features when installed will make it easier to track, maintain good habits, and also make it possible to achieve long term goal. It will also help the user to simultaneously check the effect of a habit, and also the influence on others. This kind of features will also make Loop - Habit Tracker an outstanding application as the goal of both the application creator and it's user will be achieved, interm of been able to track long term goals. The percentage pie chart will also make it easier for user to have an easy memorise of their habit performance, so as to determine what can be done towards a much more satisfactory performance.