Where is the safest place to buy on any chart?
Your looking for an imbalance in buyers and sellers where the buyers totally outnumber the sellers. You want tons of buyers and almost no sellers. That's where you want to buy, right?
Where on a chart can you find an entry where you can be sure that there is more buyers than sellers? How can you read a charts history to get a clear understanding of where buyers are willing to buy and sellers are unwilling to sell?
Years ago when I started trading I came up with a Mantra that has been my guide ever since: "no one man can make a market".. Basically that means that One person or even a few people cannot decide where a price should be. There are just too many participants with different views, therefore the current price of BTC (as an example) is a colaberation of thousands of participants, buying and selling.

It would be crazy to think that if you found 30 friends and you all dump all your BTC on the bid, that you could keep the price down for even an hour.. You might be able to drop the price for a few minutes, because you overwhelmed the book with a few big orders (the book is just a list of parcipants who have active orders). But behind the scenes, behind those bids listed on the book, there are thousands of buyers waiting and willing to submit buy orders when they feel there is a deal (a cheap buy price). So the book is really just a small representation, a small subset of the actual participants who are ready and willing to press buy or sell. So while you might be able to quickly move the price on the book, the is a crowd behind the scenes ready to refresh those bids.
What is consolidation?
Consolidation is where buyers and sellers are starting to agree on a price. Lets say for example that some news just moved the price a few hours ago. After the initial move happens some participants will reject the new price and take the opposite trade, but other will support the new price and continue to trade in that direction.. Eventually there will be a range that forms where buyers exhaust sellers and sellers exhaust buyers and a new price area is accepted by the majority.. Its like an argument. Say the price was 3 and ran to 10, but then came in a bunch of sellers who felt that 10 was a great place to take profits. Still others feel it should go to 20 and so they are willing to buy 9s and 8s.. but the sellers keep holding it down with more sell orders at 10.. And eventually some traders are biding/buying 9s and 8s just to trade the spread and sell at 10 for a 20% profit.. Soon everyone realizes that the price may not pass 10 and the buyers relax, and the sellers are not getting many sells anymore at 10 either, volume starts to drop off, and there is a new price range, from 9 to 10. That's consolidation, and that lasts till there is a new price breakout in either direction.
So after a while of price bouncing back and forth from 10 to 9 what would happen if you decided to unload all your ABCD onto the bid with a market order? (a market order will sell for the best price available, until you run out of coins to sell) Assuming you have quite a bit of ABCD coins, perhaps you can drop the price down to 6 in a matter of seconds, because there were not enough bid orders at 9 or 8 or 7 to eat up your sell order. But as soon as traders notice the new price of 6, the bids will start coming back in because everyone sees the same chart, and understands that 9 was a good price to buy only moments ago and 10 was a good price to sell. Just because you were willing to take any price for your coins, do you think many other will be ready to sell at 6. Do you think your sudden price drop changed everyone's mind about the value of ABCD. Nope, withing a minute buyers will be bidding, trying to get some 7s and 8 and then 9s, but you were the only seller, so there is nothing to buy at those prices and the bid is now 9 and the ask is still 10 and you managed to move the price for a second or two. You are only one guy, and cannot influence everyone,s belief of where the price should be, even with the complete dump of your account.
So how many players would it take to move BTC down a thousand bucks and "hold it down"?
The answer is: the majority. Anything less than the majority and it will bounce. Have you ever wondered why every little dip on BTC seems to bounce? That's because every little dip is being tested by the crowd, and if THERE ISNT ENOUGH PEOPLE TO HOLD IT DOWN, it will return to where everyone thinks its a buy or a sell. This also explains why news moves markets, because it influences traders to change there outlook and then many traders at once may turn from buyers to sellers or from sellers to buyers.
Consider this: In every market there is a limited amount of sellers but an unlimited amount of buyers. Take BTC as an example, how many sellers are there, if you include all the short sellers and all the BTC owners? Ok, i dont have a clue, but lets guess between 1,000 and 100,000 sellers can come into the market at anytime.. How many buyers are there? Unlimitted.. Loads and loads of new buyers entering the market daily. That doesn't meant there wont be a correction or a bear market at some point, where the Majority of the traders feel the price has gotten too high and fear starts to set into our market for a while.
Why do so many traders fail when using Technical Analisys and Indicators?
Reading a chart effectively is really about understanding the where the crowd thinks price should be relative to where it is, and how quickly it has recently moved away from points of consolidation.. When it comes to using TA, and indicators, there is often a huge component missing, and thats the understanding of Why prices move.
Looking behind the curtain
In my blog, I am really trying to get everyone to see whats behind the chart, to see the chart as a story of the auction, and to understand where the majority of the players are positioned, and how to take advantage of that information, by reacting to price action that is clearly at unreasonable prices.. it's like using an program that you have downbloade and trying to predict what will happen when you press certain buttons, or looking more deeply and examining the code behind the program and understanding exactly how those buttons were created.
My method is a crack of a base and a panic. The panic is very necessary beacuse it makes for unrealistic prices. A situation, where for a few minutes or hours, a smaller group of traders have managed to pushed the price down to obvious new lows and the crowd didn't have an opportunity to react, because everyone is not looking at the chart every momment of every day, and remember only a few people cannot dictate the price of a coin.. So after the panic, as the crowd notices the new lower price, they buy, and eventually return the price to where it surprised everyone, because that is where the crowd actually decided the price should be, before a few panicers dropped it way too far.
Lets look at some examples:

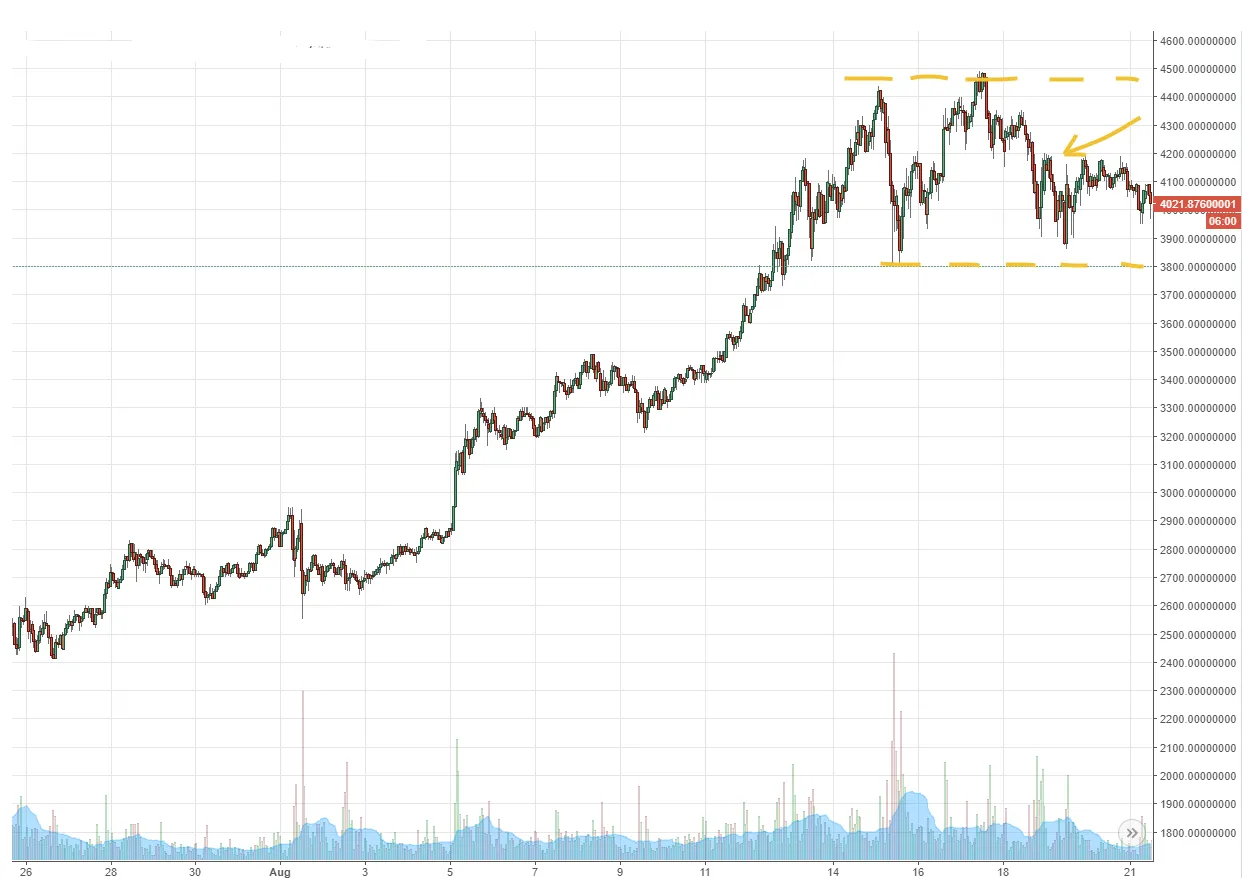
If you bought here, ($4,200)you would be predicting the future. You are a saying that even though the crowd believes that the price should be between $4,500 and $3,800 , you feel that they will eventually think its gonna be worth more.. Your chances of a successful trade are 50/50..

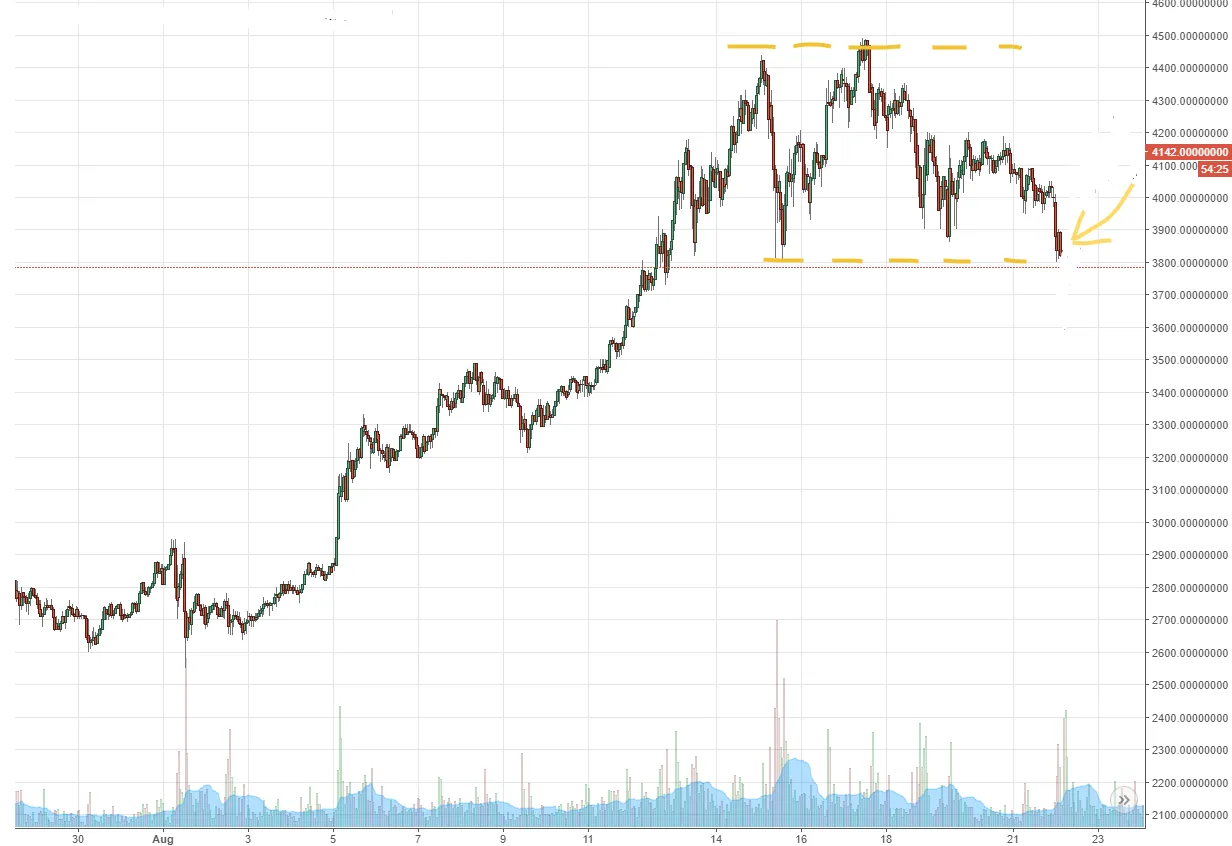
If you buy here, ($3,800 to $3,850) you would be buying beside other big players, at a price point that they have stepped in an bought in the past. They will likely buy here again and this price should be supported with a bunch of buying. If the price where to break this point than that would be a big surprise to everyone. So your chances of a successful trade here are much much higher, maybe 80% depending on where you plan to sell.

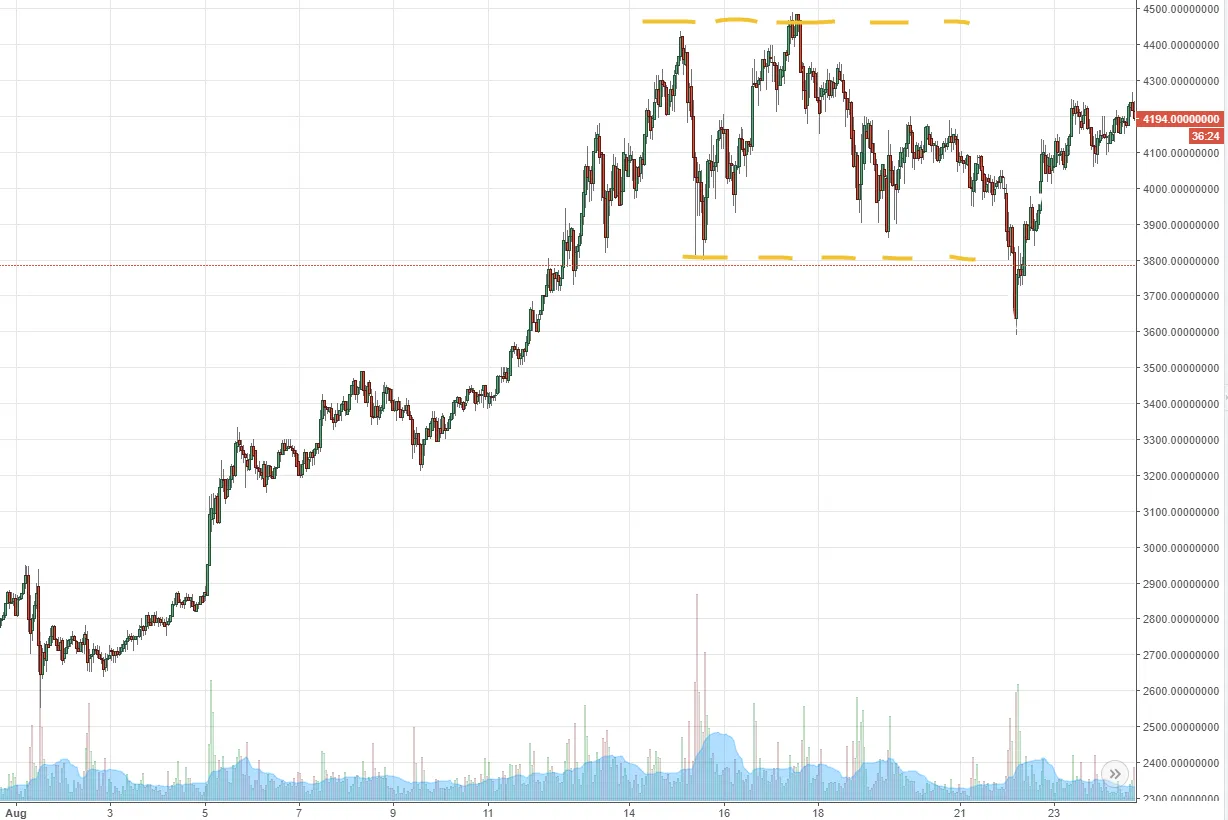
If you buy here, ($3,600 and below)in this circle, then you have bough at unrealistic prices. There has been no crowd participation in deciding on this price. A few big traders have been surprised and paniced, (or there stop loss orders were hit).. The price dropped so quickly because their orders hit the bids on book faster than the crowd can notice and react. Now that the panic is over the crowd will slowly notice the lower price and buyers will step in and unless the drop has some news behind it, the price should head back to where everyone last agreed it should be.

So again, Where is the safest place to buy on any chart? Your looking for an inbalance in buyers and sellers where the buyers totally outnumber the sellers.. Well perhaps $3,600 seemed like sellers were outnumbering the buyers, in that momment, durring the panic. But now you can see, that behind the book, there were many many more participants, waiting to spot a deal and refresh the bids all the way back up to $4,000 and higher. Now you broke the code as it were, you are seeing behind the curtain. Now your thinking like a professional trader.
Luc