Hello everyone, here I am new, please do not kick much.
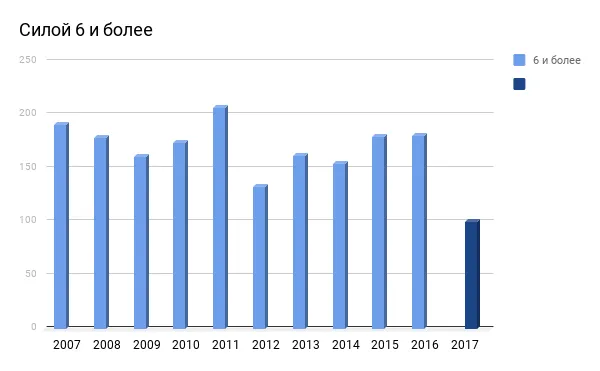
Earthquakes have recently become more frequent on the planet, well, at least that's what they say. I made a diagram of earthquakes with the strength of 6 or more points in 10 years, 2017 is highlighted in another color because it is not over yet. But I do not see more frequentities.

Although in November there are already 16 earthquakes of more than 6 balls.
6.0 25km SE of Taron, Papua New Guinea2017-11-27 07:11:12 UTC57.8 km
6.0 194km SE of Mata-Utu, Wallis and Futuna2017-11-20 18:51:07 UTC6.0 km
6.0 97km E of Tadine, New Caledonia2017-11-20 00:09:23 UTC10.0 km
7.0 86km ENE of Tadine, New Caledonia2017-11-19 22:43:29 UTC10.0 km
6.6 68km E of Tadine, New Caledonia2017-11-19 15:09:03 UTC14.2 km
6.4 74km E of Tadine, New Caledonia2017-11-19 09:25:50 UTC25.3 km
6.4 63km ENE of Nyingchi, China2017-11-17 22:34:19 UTC8.0 km
6.5 18km W of Parrita, Costa Rica2017-11-13 02:28:23 UTC19.4 km
7.3 30km S of Halabjah, Iraq2017-11-12 18:18:17 UTC19.0 km
6.1 Ascension Island region2017-11-11 00:36:14 UTC10.0 km
6.0 165km ESE of Hachijo-jima, Japan2017-11-09 07:42:11 UTC12.0 km
6.5 67km WSW of Angoram, Papua New Guinea2017-11-07 21:26:38 UTC107.4 km
6.8 86km NE of Hihifo, Tonga2017-11-04 09:00:19 UTC10.0 km
6.0 110km ESE of Tadine, New Caledonia2017-11-01 05:09:00 UTC10.0 km
6.6 104km E of Tadine, New Caledonia2017-11-01 02:23:55 UTC9.9 km
6.1 110km E of Tadine, New Caledonia2017-11-01 00:09:29 UTC10.0 km
It's more interesting, but not that. In general, there is still nothing to fear. I plan to make graphics from 2 points with energy. Soon, wait.
But on Yellowstone has something to think about. Graphs and a description the other day.
Pictures as always from the network.