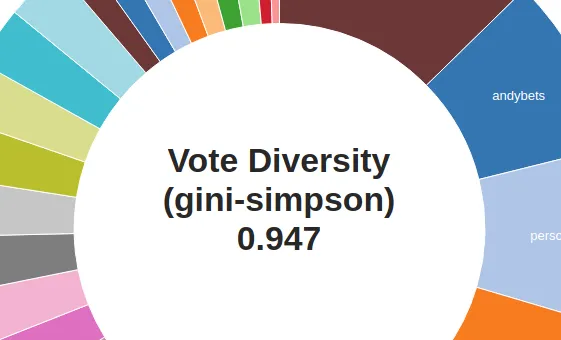
I have been been wanting to create a report which shows a measure of how well a person spreads out (disperses) their votes for a while, but my early attempts weren't very good. In a recent discussion with @clayop, he independently suggested that it would be useful to add a diversity index for this purpose.

http://www.steemreports.com/outgoing-votes-diversity/
I wasn't aware of the terminology, but checking the appropriate wikipedia article made it clear this was what I had been looking for too.
There are actually a few such diversity metrics, and since the implementation was easy enough, I added a few that may be of use.
Gini-Simpson Index (derived from the Simpson index)
This shows the probability that two vote allocations taken at random are not to the same account. I like this measure because 0.0 represents a voter who gives all his votes to a single recipient, and as the value approaches 1.0 it means the votes has distributed his votes over a very large number of accounts.
Inverse Simpson Index
This gives an idea of the number of voters who have been effectively voted for, but is otherwise difficult to explain.
Shannon Index
The Shannon index has apparently been a popular diversity index in the ecological literature, but is again difficult to explain without resorting to maths.
You can read more about what these indexes represent online below:
https://en.wikipedia.org/wiki/Diversity_index
https://en.wikipedia.org/wiki/Herfindahl_index
I like the Gini-Simpson Index tool best. As the results are not only clear and bounded between zero and one, but can probably be understood and communicated most easily.