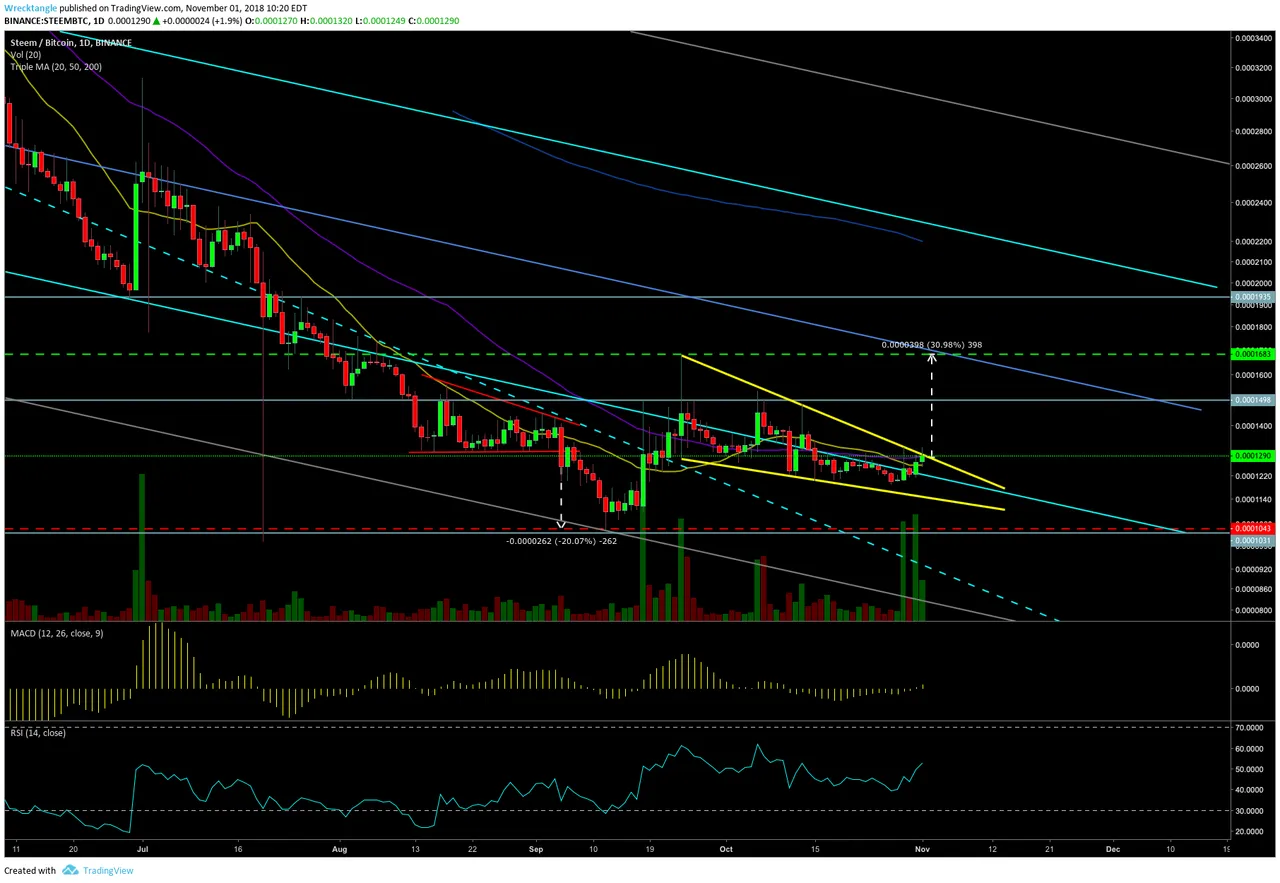
We got over one hurdle, we got one more to go:

75% fib retirement surpassed with volume. Check. Next area we need to get through is 1498 SATS. Thats where we have a lot of horizontal resistance that we need to penetrate. We are also starting to paint a falling wedge (bullish short term). Measured move up out of the wedge is at 1683 SATS. This area is right at your 50% fib channel retracement zone. If this pattern plays out, we will be overcoming all the obstacles we need to finally begin a bullish trend. Hallelujah! Expect resistance at the 50% fib if we break above the wedge and horizontal resistance though. That would make sense because usually after hitting the measured target we retrace to gear another leg up.
Our indicators are neutral, but both the RSI and MACD are starting to gain some positive momentum so we have plenty of room to head up. Breaking the wedge is our next goal in the very short term. I wouldn't want to see us touch the bottom of the wedge considering that would take us back below the fib channel resistance level. It took a while to break it, so we wouldn't want to start that process over again. It kind of needs to break soon because we're running out of time. We are also above your 20 and 50 MA on the daily and we are slowly increasing the gap between the diagonal resistance as well.
The chart looks good. Lets see if we can break out of the wedge and start calculating bullish breakouts for once. We will know within a day or two whether this bullish pattern plays out. As of now, we got to like what we're seeing right now.
Hope this helps!