What's a p-value?
In the life sciences, the bread and butter of scientific progress is hypothesis testing, where the scientist tries to disprove a “null hypothesis” in favor of some “alternative hypothesis.” One of the major statistical tools that the scientist has at their disposal is a p-value, which describes the probability of obtaining a result at least as extreme as the result that you observed, assuming that the null hypothesis was correct. Therefore, really low p-values give scientists greater confidence to reject a null hypothesis in favor of an alternative hypothesis. For instance, a p-value of 0.05 tells a scientist that if the null hypothesis were true, there would only be a 5% chance of finding the same result due to chance, so they reject that null because that is a pretty low chance. In many of the life sciences, it is typical to use p-values of 0.05 as a reasonable cut-off, usually after adjusting that value if the researcher is making multiple comparisons.

The problem is that a lot of researchers simplify that definition in their minds to expect that only 5% of studies will have false positives, which is not true, and depends a lot on how likely it is that the alternative hypothesis is true in the first place.
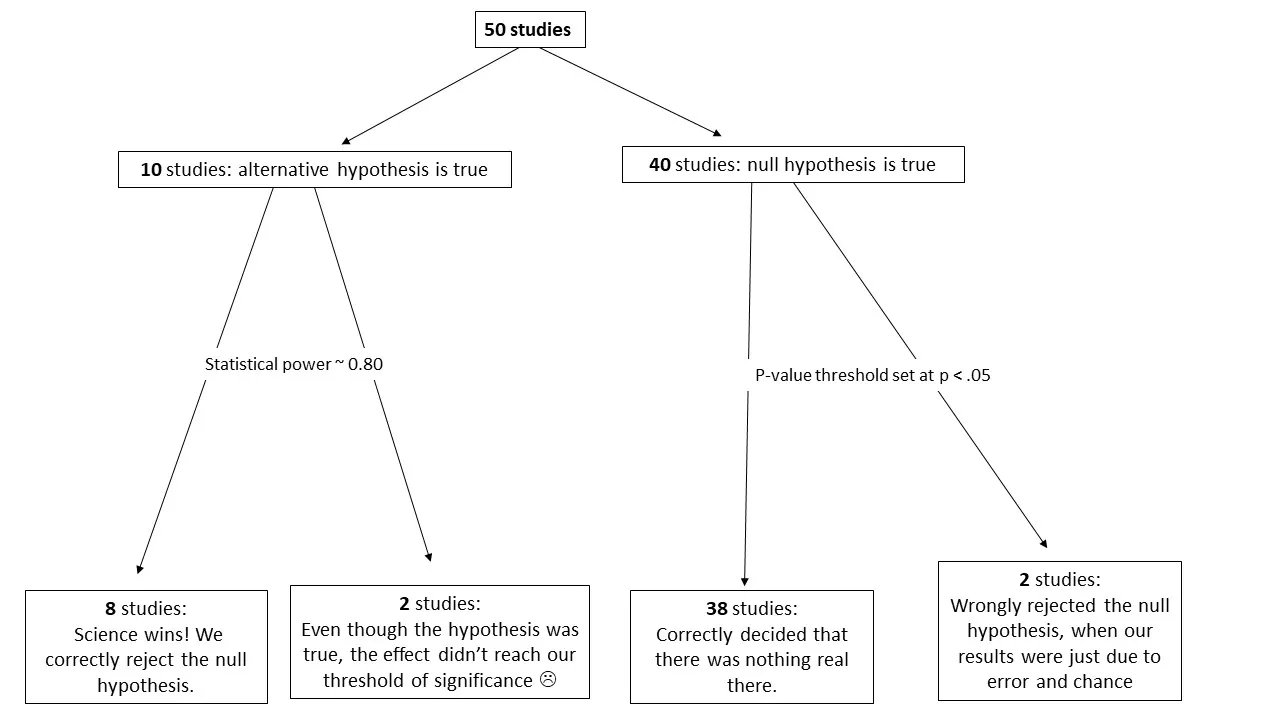
I think the easiest way to demonstrate this is by pretending we know everything about the truth of some hypotheses being tested, and then looking at what our false positive rate turns out to be. Let’s say we conduct 50 studies. In 10 of those studies the alternative hypothesis is true. In 40 of those studies the null hypothesis is true. Out of the 10 studies where the alternative hypothesis is true, we correctly reject the null hypothesis in 8 of those studies. Why not all 10? Well, correctly rejecting the null hypothesis also depends on our “statistical power”, which is the probability of rejecting the null when the alternative is true. It is typical for researchers to try to design their studies so that there is a power of around 0.8 (or an 80% chance of rejecting the null if the alternative is true).
Now let’s look at the 40 studies with true null hypotheses. In these studies, because we’ve set our p-value threshold at 0.05, we would expect to reject the null hypothesis due to chance alone in only 5% of the cases, so in only 2 of the 40 studies. In 38 of the 40 studies, our threshold prevents us from incorrectly rejecting the null hypothesis. But now let’s assume that all of the studies that rejected the null hypothesis were published.

We can see that there would be 10 published studies, but 2 of those published studies are false positives. This corresponds to a 20% false positive rate in the scientific literature, rather than the 5% false positive rate that many people wrongly expect. In this example, the proportion of true alternative hypotheses was 0.2, but in many life sciences, this proportion is even smaller, which would lead to an expected false positive rate that is even higher.
Because the false positive rate is so high, some prominent researchers are advocating for a reduction in the p-value threshold cut-off to 0.005 instead of 0.05 (Benjamin et al., 2017). Whether or not scientific fields in the life sciences adopt this change still remains to be seen.
References:
Benjamin, D.J., Berger, J., Johannesson, M., Nosek, B.A., Wagenmakers, E.-J., Berk, R., … Johnson, V. (2017). Redefine statistical significance. doi: 10.17605/OSF.IO/MKY9J
Image credit: https://lovestats.wordpress.com/dman/survey-research-statistics-meme/