This is probably my favorite tip to offer. If you haven't heard of Jupyter Notebooks, this is going to be a huge game changer for you.
While I only use Jupyter Notebooks with Python, I know it can be used with lots of languages and frameworks. I only have experience using it for Python and Machine Learning.
Jupyter Notebooks is different than anything I have ever seen before, the closest thing I describe it to is an interactive shell with charting, visualization, interactive widgets, reporting, and so much more.
Python is frequently used for data analysis and machine learning, in this capacity you are frequently working with large datasets and visualization.
You might be doing something where you have a simple dataset where you want to chart it.
To something far more complicated involving interactive charting and complex math.
I am not going to go to in depth as this is more to introduce you to the fact that Jupyter Notebooks exists and what it can do. To cover how to use it would be far more than I can do in a single post.
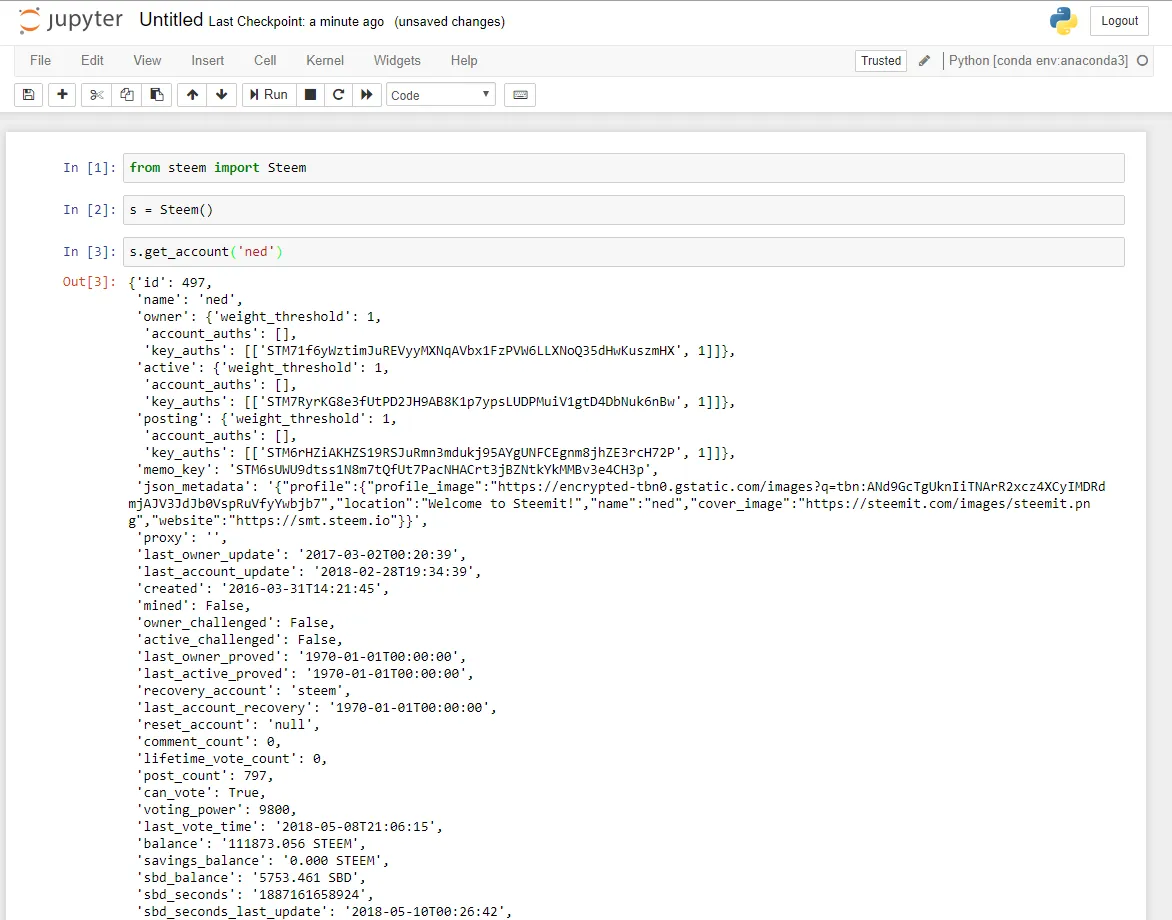
One use for Jupyter Notebooks that isn't talked about a lot is when you are testing out code and working with an API and want to have instant feedback. One of the nice things is you can run each block individually, so you can run your import block and setup code, then mess around with your experimental code re-running it as needed as you test things out.
If you have to import a new module, just add it to the import block and re-run that block or the entire notebook.
Let's take a simple Steem example:

Now we decide we want to do something with datetime, we can easily update the top block to have import datetime and re-run just that part.

We don't have to re-run the entire script if we don't want to. If you break your scripts into chunks and put them into different cells, it becomes easy to change parts of your code and re-run only what you need.
I don't recommend using Notebooks for everything, but there is a lot of code I run that is more of reporting and data collection on the blockchain and it is far easier to do this in a Jupyter Notebook than command line or an IDE.
When working with lots of data you want to graph and see visually, Jupyter Notebooks cannot be beaten.
If you use Anaconda for your Python distribution (highly recommended) you don't need to do anything to install Jupyter Notebooks, you already have it. Just type jupyter notebook from a command line and it will start running.
There is a newer version of Jupyter Notebook called Jupyter Lab which is in development and beta. It has some additional features like tabs, text editor support, data file viewers, and some new components that makes it much more powerful. It is also fully compatible with Jupyter Notebook files. I suggest using Jupyter Notebooks first, and testing Lab when you are familiar with Notebook.
Sharing
One of the best things about Jupyter Notebooks is the ability to share Notebooks with other people and easily export them into PDF format for those who don't have Python installed.
Github also has full support for Notebooks, if there are notebooks in your repo, you can just view them online without having anything installed. Very cool.
Examples
There are lots of examples you can look at on Jupyter's website under the nbviewer. One of the great things about Jupyter Notebooks is you can mix Markdown with Code and create really great reports and data visualization that can be shared easily. The end user can view the notebook as a PDF, HTML file, or even as a Notebook they can run and edit themselves.


