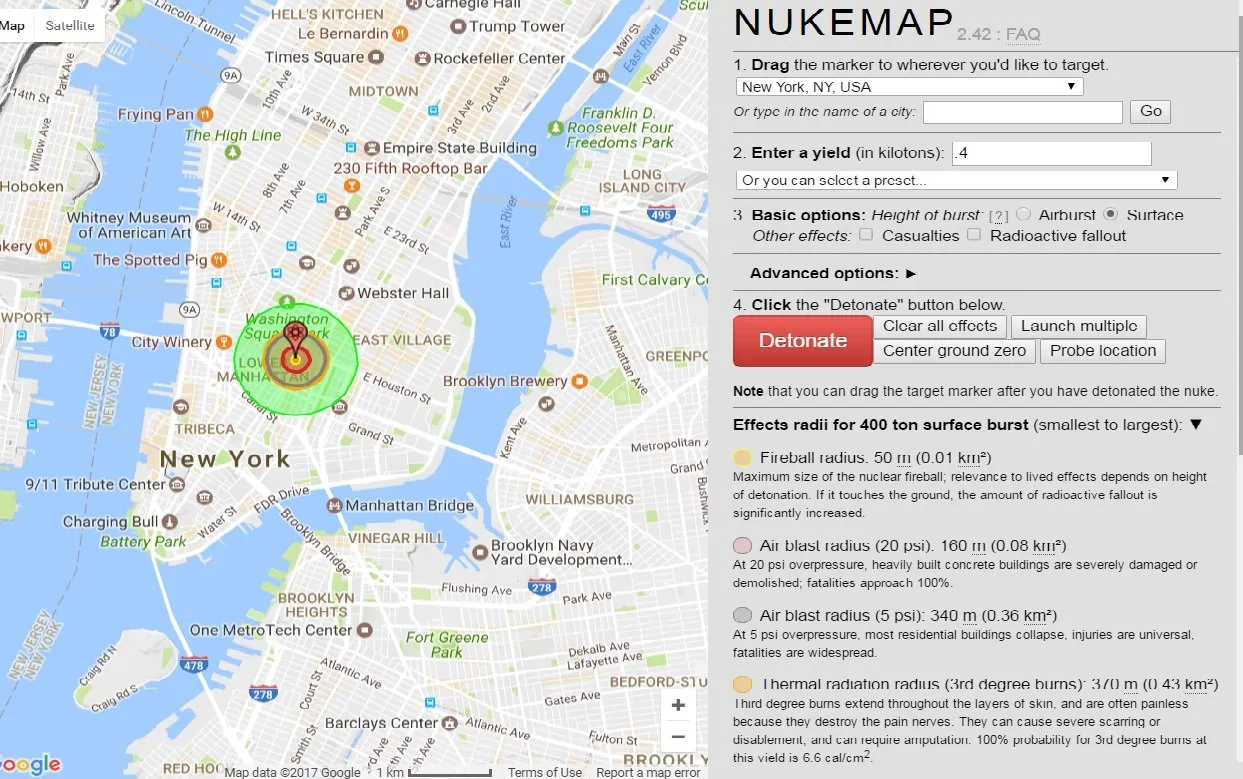
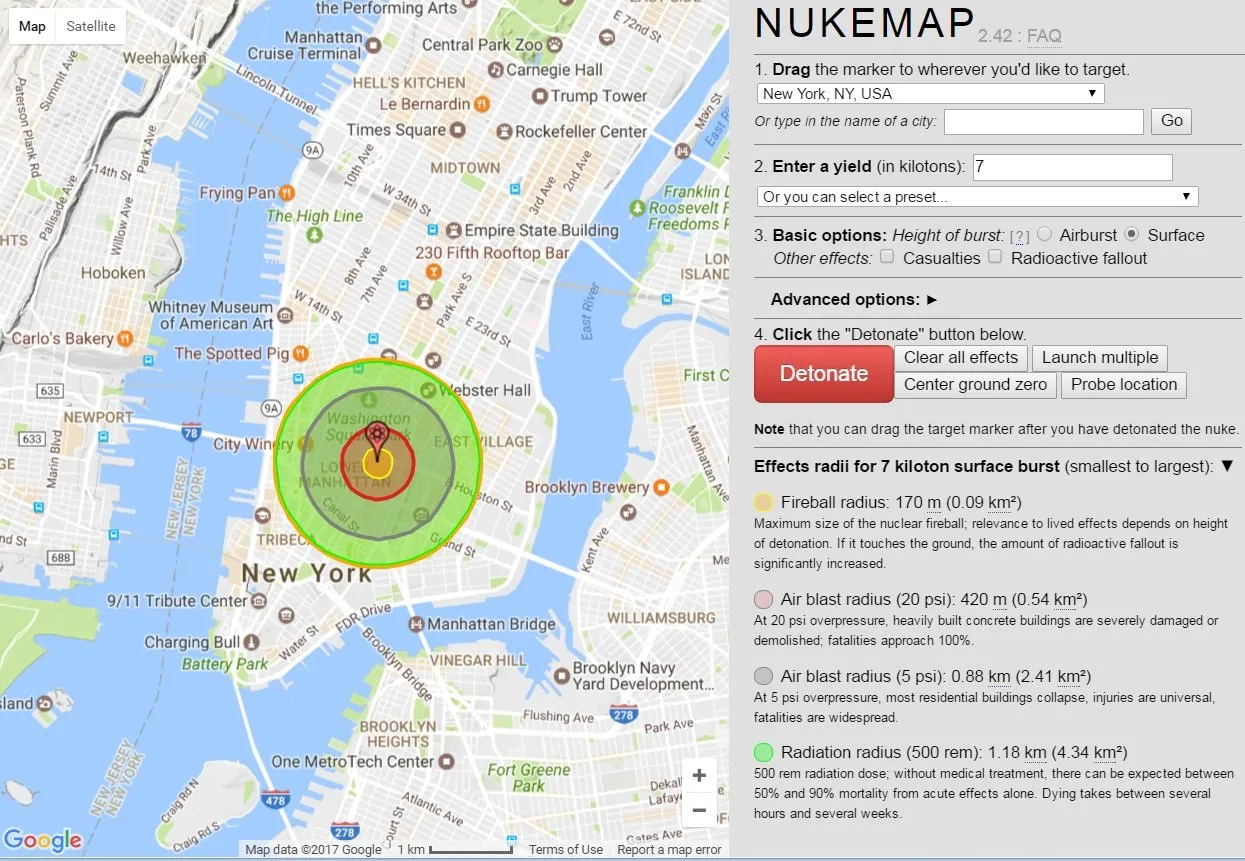
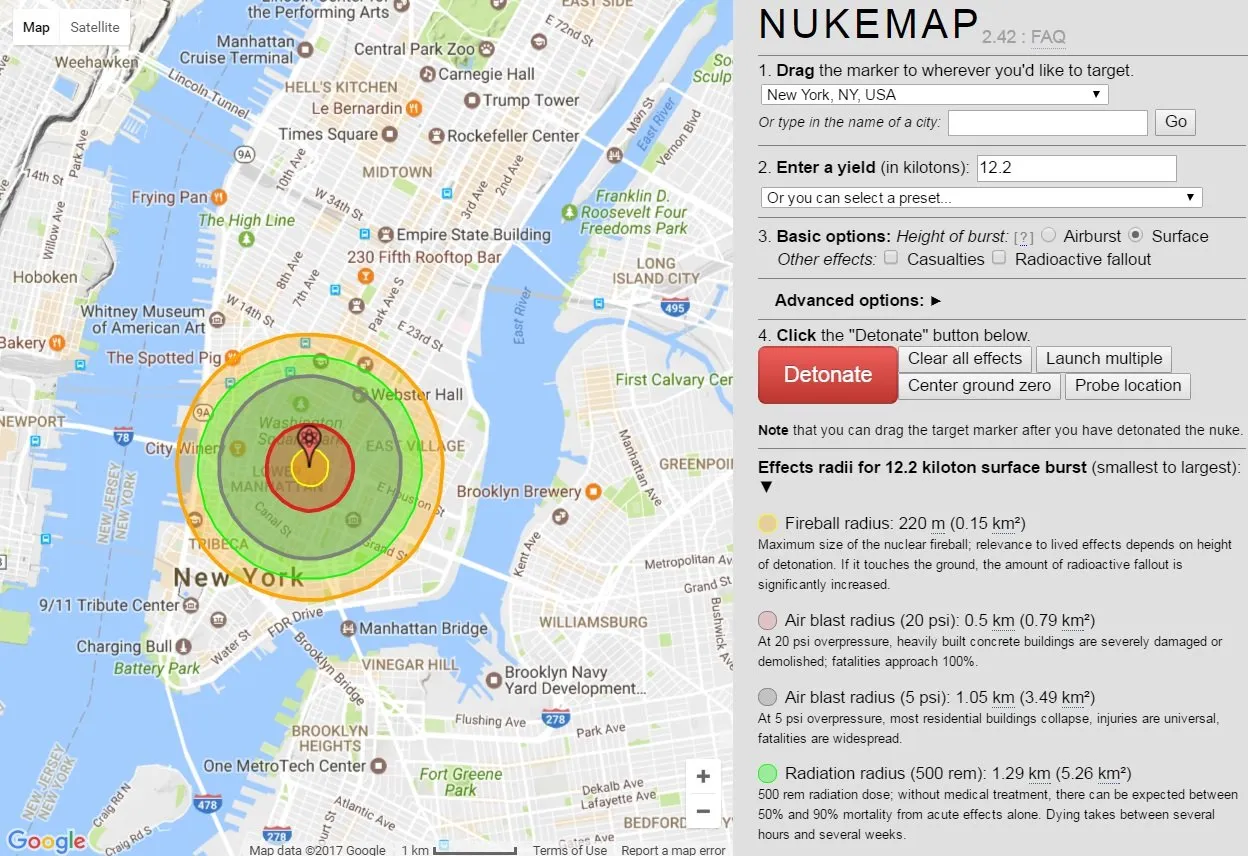
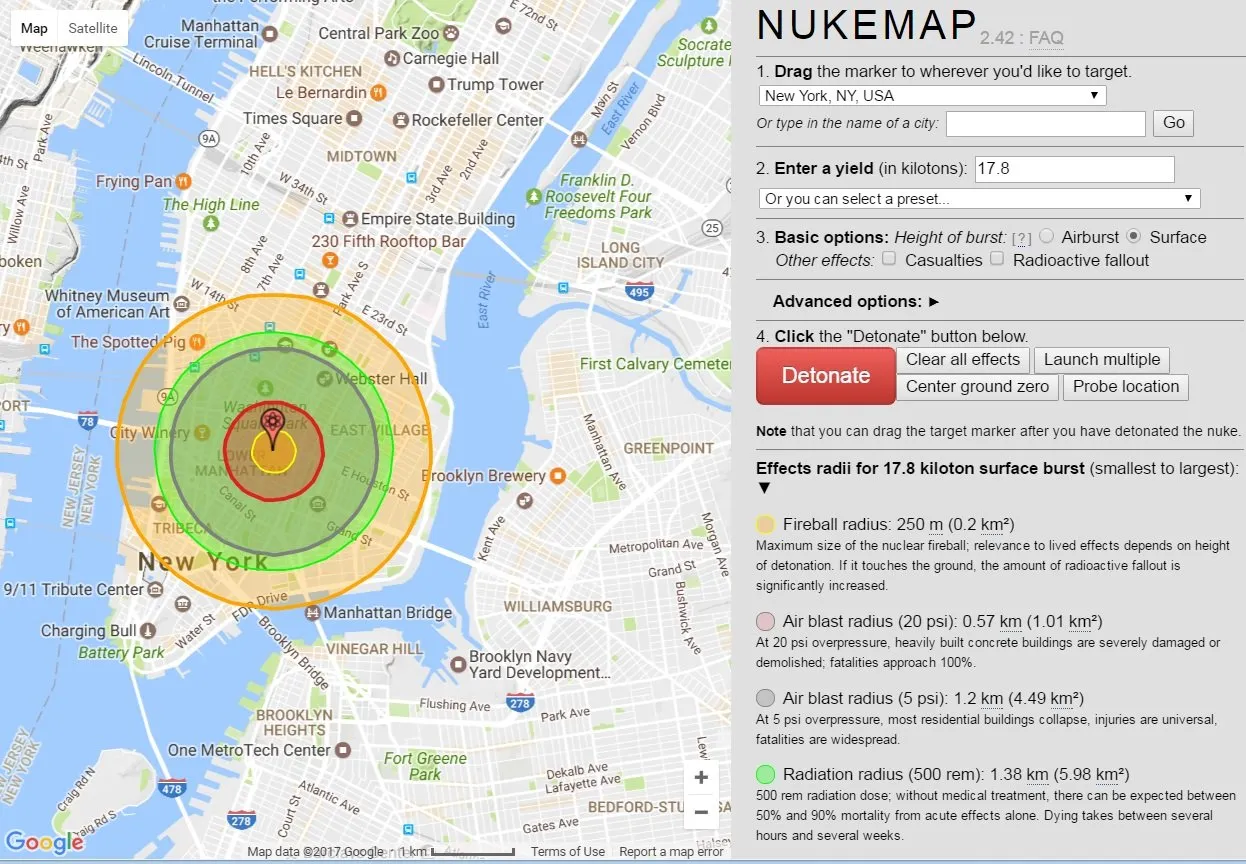
Many news outlets have reported North Korea's intentions to conduct a sixth nuclear test within the next few days. The United States has responded by positioning two Destroyers in the region. Additionally the Pentagon announced that the USA Carl Vinson aircraft carrier is also being diverted to the area.
The purpose of this post is to look at information regarding North Korea's previous 5 nuclear tests and the country's advancement in nuclear technology. Through published reports we will find out the approximate increase of nuclear detonation size from tests conducted in 2006, 2009, 2013, January 2016, and September 2016. Then the detonation size will be visualized in relationship to a major U.S city using graphics with the help of the Nuke Map found at Nuclear Secrecy. Finally, all 5 blasts will be compared side by side in a bar graph located at the bottom of the post. **Note: A kiloton is a unit of explosive power equivalent to 1,000 tons of TNT.**
It is unclear if the first nuclear test in 2006 was even successful. The Bulletin of the Seismological Society of America(BSSA) estimated in 2008 this nuclear test had a yield of .4 kilotons(kt). It was the speculation of many countries the nuclear test had an explosive force of less than 1 kt. There was some radioactive output detected from this test. There is still speculation on the actual size of the blast due to the blasts registering an equivalent of a 4.2 earthquake on the Richter scale. These estimates calculate yield of 2 - 12 kt. For the purpose of the graphic we will use the .4 kt estimate as further tests do increase in size.

The United States believed the 2009 Nuclear Test "yielded an explosion of a few kilotons". The University of Science and Technology of China(USTC) pinpointed the test location and estimated the yield to be 7 kt with a margin of error of +/- 1.9. This would put the estimate of the blast between 5.1 kt to 8.9 kt. For the purpose of the graphic I will use the 7 kt estimate, as reported by the the USTC.

The third North Korean nuclear test conducted in 2013 has yield estimates ranging from 6 kt to as high as 14 kt. BBC News reported in 2013 because the test site's geology was not well understood it was hard to get an exact yield estimate. However in June of 2013 the University of Science and Technology of China (USTC) once again released a report claiming the exact location of the test. They estimated the yield to be around 12.2 kt with an margin of error of +/- 3.8. For the purpose of the graphic we will use the 12.2 kt estimate.

The fourth nuclear test was conducted in January of 2016. The Korean Central news agency claimed this test was of a hydrogen bomb. Many countries believe this was not a hydrogen bomb test. However John Carlson, the former head of the Australian Safeguards and Non-Proliferation Office wonders if North Korea may have made a hydrogen bomb on a "smaller scale, capable of being put on to a missile”. South Korea believes the explosion had a yield of 6-9 kt while Russia estimates more than a 7 kt yield. For the purpose of the graph we will use a 7 kt estimate. Note: I personally find it interesting this test is estimated to have a smaller yield then the 2013 test. Even if this test was not a hydrogen bomb I do wonder if John Carlson is correct in regard to North Korea developing a smaller nuclear bomb in physical size compared to the previous tests.

The last nuclear test occurred in September 2016. South Korea and Japan estimated the nuclear yield to be 10 kt. However the University of Science and Technology of China estimated to yield to be 17.8 kt with a margin of error of +/- 5.9. The 17.8 kt yield will be used for the purpose of the graphic. because the USTC was for a third time able to pinpoint the location of the Nuclear Test Site .

In conclusion, North Korea has successfully increased their nuclear kiloton power year over year except for one(January 2016). However, if North Korea did manage to shrink the size of their nuclear bomb in January 2016 and maintain the same kiloton power as the 2009 test, I would personally consider it a success. While I do understand estimates vary by country for each test, I tried to choose the kiloton sizes that were based on the most seismographic data or data that relied on the exact location of the nuclear test. I hope you all have a better understanding of what North Korea could be possible of if they do manage to put a nuclear payload on a missile or rocket and reach their intended destination.

Chart created by @Lexikon82