SUMMARY
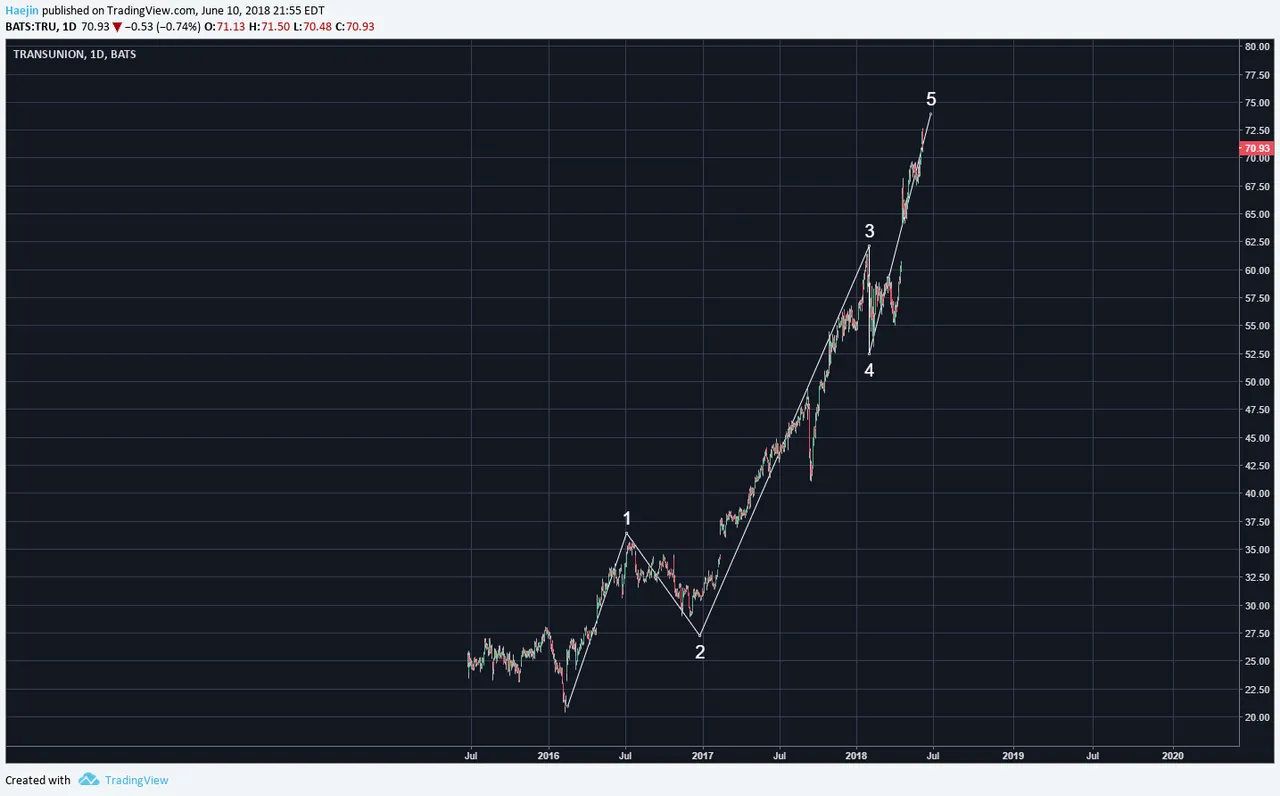
Price topping is not an event but a process. Once can't easily say here is the top or there shall be the top but rather identify the indicators of a topping process in price, patterns and Elliott Waves. To this end, the below chart of Transunion (TRU) is exhibiting a completion of five wave impulse sequence. What else can be indicative of a topping process? Any patterns?

The upward pointing wedge (white lines) shows that price is traversing well within the boundaries of the contracting lines. I believe price could breach the lower white trendline at any moment. Would this be an ideal time to be buying or selling? The red ABC sequence is the projected correction towards the 0.618 Fib leve. As there is a cluster of support in that region; it could potentially also target the prior wave 2 as the next support cluster.

Legal Disclaimer: I am not a financial advisor nor is any content in this article presented as financial advice. The information provided in this blog post and any other posts that I make and any accompanying material is for informational purposes only. It should not be considered financial or investment advice of any kind. One should consult with a financial or investment professional to determine what may be best for your individual needs. Plain English: This is only my opinion, make of it what you wish. What does this mean? It means it's not advice nor recommendation to either buy or sell anything! It's only meant for use as informative or entertainment purposes.
--


__