SUMMARY
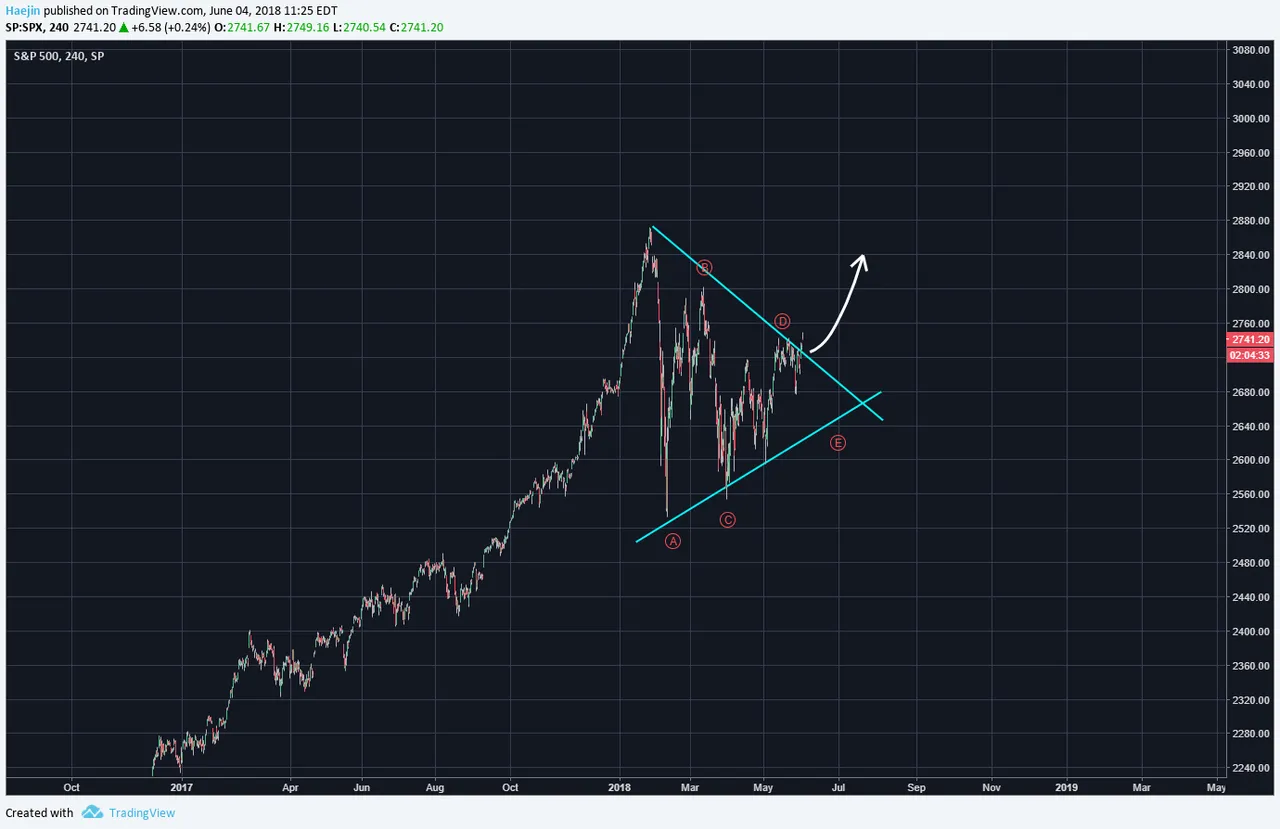
This is a daily S&P 500 (SPX) analysis which will be the first featured post going forward. All Crypto analysis will be posted on the Bitcoin Live platform. The below chart shows the symmetrical triangle pattern update. Almost always, a triangle pattern is either a wave 2 or a wave 4; so they represent corrective consolidation so as to allow the price churn between the buyers and sellers. Also, just because a pattern looks like a triangle does not mean it must generate the ABCDE sequence of waves. That's why there are plenty of D wave breakouts and that is pretty much what could be in progress right now with the SPX. Video has more details!

Legal Disclaimer: I am not a financial advisor nor is any content in this article presented as financial advice. The information provided in this blog post and any other posts that I make and any accompanying material is for informational purposes only. It should not be considered financial or investment advice of any kind. One should consult with a financial or investment professional to determine what may be best for your individual needs. Plain English: This is only my opinion, make of it what you wish. What does this mean? It means it's not advice nor recommendation to either buy or sell anything! It's only meant for use as informative or entertainment purposes.
--


