Good morning traders! Market's got you down? No problem, we have good news! Grab a coffee and read on to find out, why should you...

pixabay.com
...buy Bitcoin
When hodlers and long-side traders see their precious portfolio worth wither away, cryptocurrencies portrayed in negative light in mainstream media and only scammy ICO's making money in these markets, it's easy to describe this with one word - "Misery".
Wall Street strategist Thomas Lee has created a "misery index", which - you guessed it, right? - tells us when to buy Bitcoin.
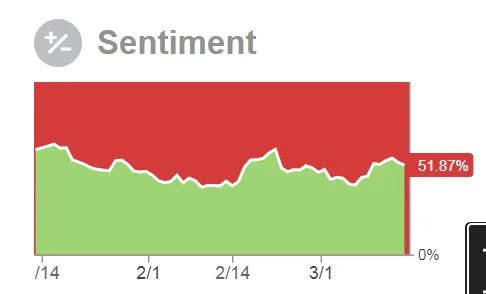
What is the misery index? The misery index is nothing spectacular, when you take a look at it - it's a sentiment indicator, which are used on various markets. Sentiment indicators usually measure the sentiment of the market from the viewpoint of bearish or bullish, but often with little variations - some measure the mood in tweets, messages or directly ask whether bullish or bearish (StockTwits). Some, on the other hand, measure traders positions on the market (DAX - Euwax sentiment). Here's an example of the Dow Jones Industrial Average sentiment on the StockTwits platform:

https://stocktwits.com/symbol/DJIA
As you can see on the above chart, bulls and bears are equal, which, if generalizing things - means that market is expected to move sideways. Many use the sentiment indicators as contrarian signals - explaining, that the crowd is always wrong. Sentiment indicator shows investors are bullish? Time to sell.
End of crash course. Now we come back to the Bitcoin "misery index". The index in question is a contrarian indicator and "takes into for the number of winning trades from the total trades. It also accounts for volatility etc". Forget the details - we have the necessary info - it's a contrarian indicator. Meaning when it's at a high point, the retail crowd is bullish and it's time for you, the educated investor, to abandon ship. When it's low- it's a great buy.
Key points from CNBC:

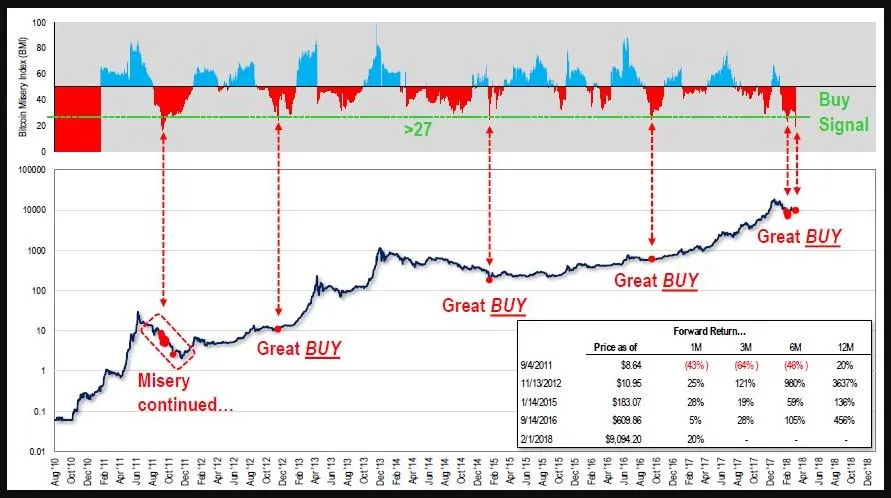
So according to Thomas Lee, the creator of the index, a signal is created approximately once year, and this time we have a great one - the index is at 18.8 - the lowest point in 7 years. If the index falls below 27, the misery level, next 12 months performance is expected to be spectacular.
Enough about my craptalk! Let's have the data do the talking:
As you can see, the misery index is represented at the top as an oscillator and being on the ultranegative side and falling below the misery level signals an excllent medium-term or a long-term buy. During the last 4 times mapped on the BMI (Bitcoin Misery Index) when it dropped below 27, there was not a single instance, when Bitcoin wasn't up spectacularly in the next year.
Thomas Lee himself has Bitcoin mid-year and end-year targets set as 20000 and 25000 respectively.
Wanna read the original story and not my opinion? Sure, head to CNBC
Still undecided?? Wow. Maybe this picture of a true story will convince you:

Sell your vote to minnowbooster and earn SBD
Check out Chainbb, an alternative frontend for STEEM network. If you like forum style, that's the platform for you.
Title image from pixabay


Are you looking for Minnowbooster, Buildteam or Steemvoter support? Or are you looking to grow on Steemit or just chat? Check out Minnowbooster Discord Chat via the link below.

BuildTeam
