To be a successful trader, using a combination of technical analysis and fundamental analysis is crucial. A number of new traders rely too heavily on technical and don’t pay attention to the fundamentals. One trading method is to use fundamental for direction and technical for entry and exit points. I’ll use the USDJPY as an example. I strongly suggest you set up an account with TradingView.com for better technical analysis.
Fundamentals:
Interest Rates
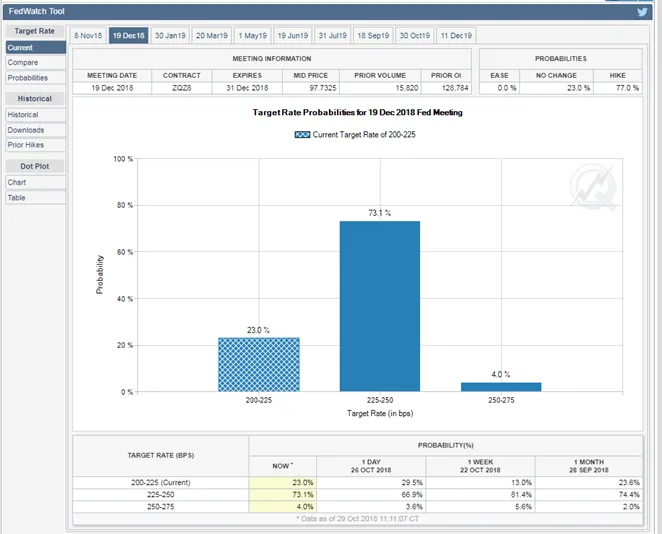
The CME FedWatch Tool is putting a 77.1% chance of a rate hike for the FED in December. https://www.cmegroup.com/trading/interest-rates/countdown-to-fomc.html Interest rates are important for currencies and should be something a trader is aware of.

Predictions

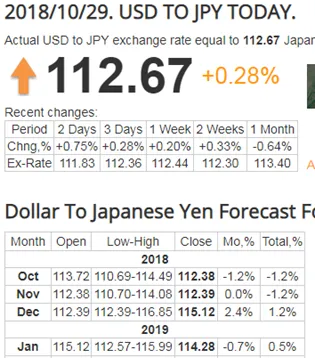
Look for predictions about future prices, major banks do this such as NAB, Westpac, Bank of America, but you can easily access predictions here: https://longforecast.com/
Predictions will vary widely, don’t ever expect a consensus from all analysts, but we can see here predictions for USDJPY are bullish towards 114-115 by December and January next year. This tells us to look for opportunities to buy USDJPY, so now technical analysis can help to decide entry points.
Technical Analysis:
Bollinger Bands and Relative Strength Index
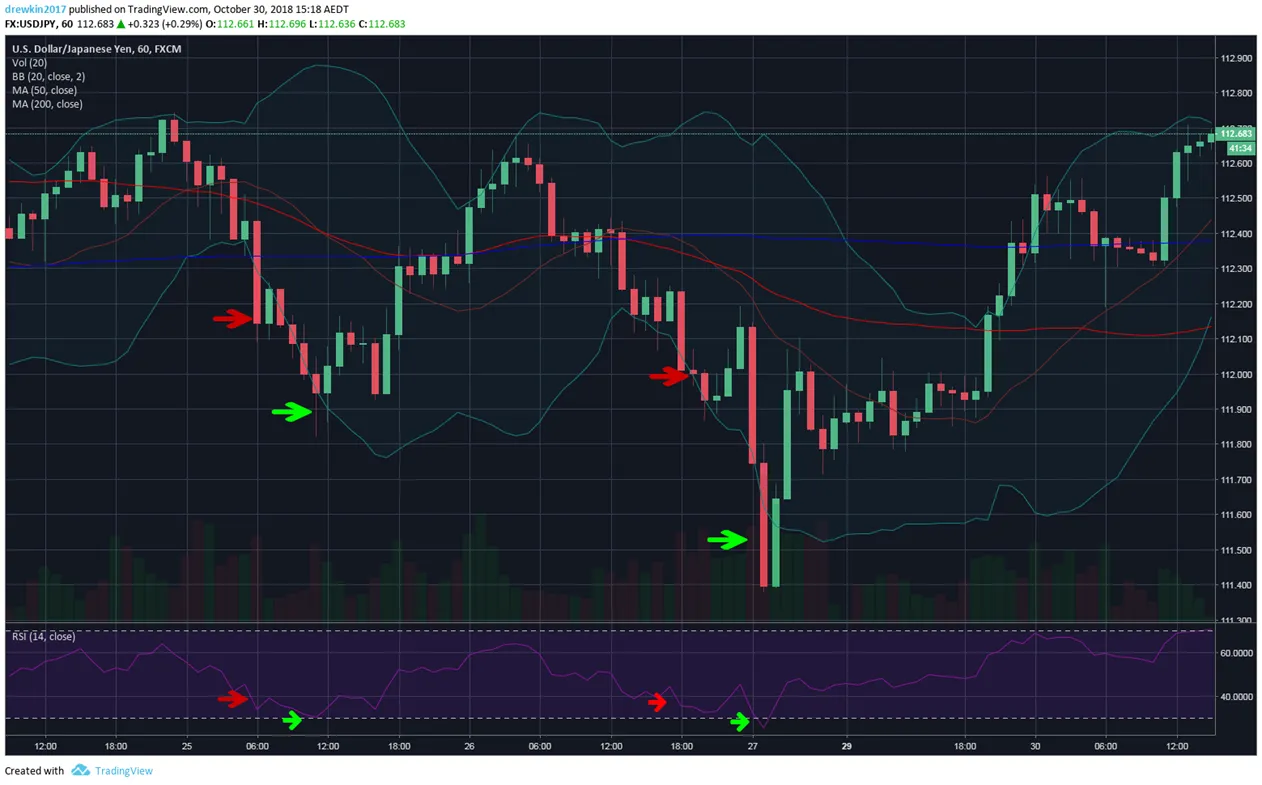
The charts below are from the last few days. Using one method which includes only two indicators, Bollinger Bands and RSI, we can see entry points shown by the green arrows. The reason two indicators can be beneficial is seen by the false signals on the BB with the red arrows. The RSI in those situations did not indicate a buy opportunity. Use BB/RSI to look for closing prices, traders could consider closing at the moving average price which is the centre of the BB.

To summarise:
- Look for direction using fundamental analysis
- Using technical analysis to enter and exit your trades.
- Always be prepared for an alternative scenario.