EN
"Citizen Science" Project Activity Report 6 - Simulation of a neutrino signal at CERN’s Large Hadron Collider with its uncertainties
By Enio...
Summary
This is the sixth installment of the report of activities that I do as a participant in the participatory research project Citizen science particle physics project on Hive led by @lemouth and undertaken by a number of blockchain science enthusiasts. It describes the tasks that help us simulate a neutrino signal at CERN’s Large Hadron Collider with its uncertainties. The instructions for this can be found in this post. I managed to complete the given task, replicating the expected results, although in the process I got some unexpected errors related to environment variables. I also did the assignment about "Leading-order rate dependence on the neutrino mass", resetting parameters, redoing the calculations, programming and printing a chart. I thank @lemouth in advance for the respective review and advice.
Task 1: A working directory for leading-order simulations
I already had MG5aMC installed from previous episodes. When I launched it I noticed that the program informed me that there was a newer version available and offered me the possibility to update automatically, which I did. After that, I repeated the tasks of episode 5 since @lemouth informed me that I apparently had errors in my parameters. When I finished them and proceeded to perform the tasks of episode 6, interestingly enough I found that I basically had to repeat a task from episode 5. What a coincidence.
Anyway, I proceeded to run in Mg5:
import model SM_HeavyN_NLO
define p = g u c d s u~ c~ d~ s~
define j = p
generate p p > mu+ mu+ j j QED=4 QCD=0 $$ w+ w- / n2 n3
add process p p > mu- mu- j j QED=4 QCD=0 $$ w+ w- / n2 n3
output episode6_lo
This generated the episode6_lo directory. Subsequently, I proceeded to run MG5_aMC>launch in order to recalculate the leading-order rate associated with our signal. I decided to set Nano as the text editor of choice and then modified the parameters of the neutrino model file, as follows:
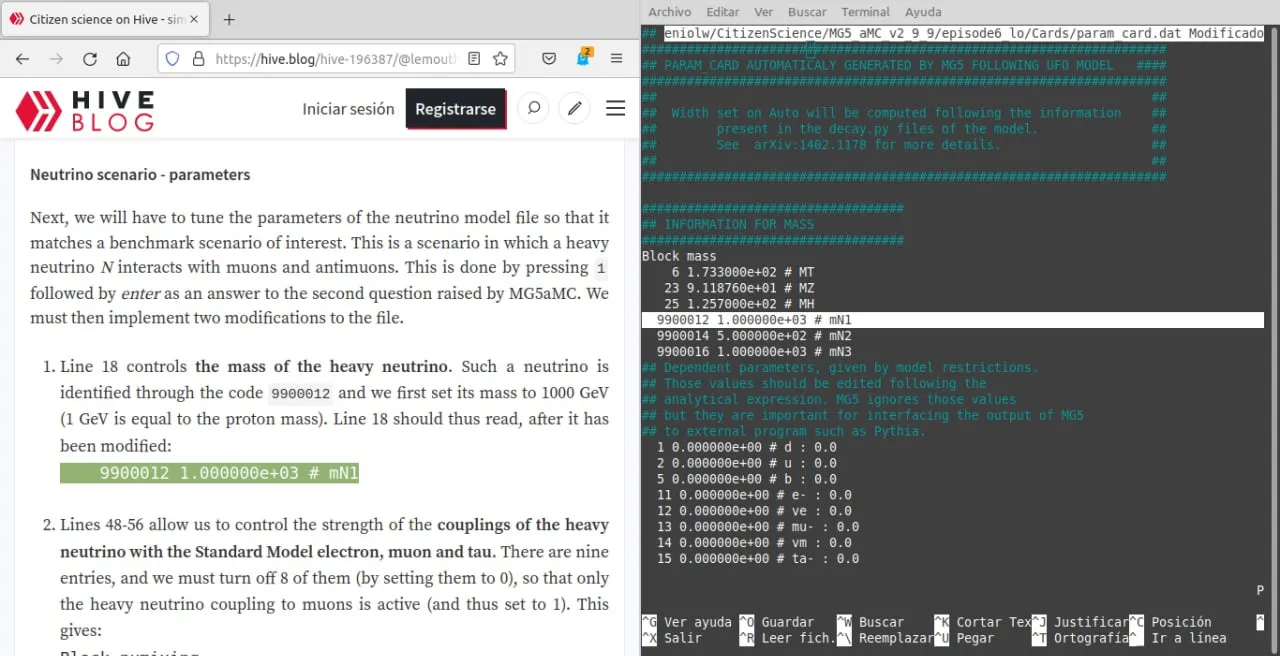
⬆️ Image 1
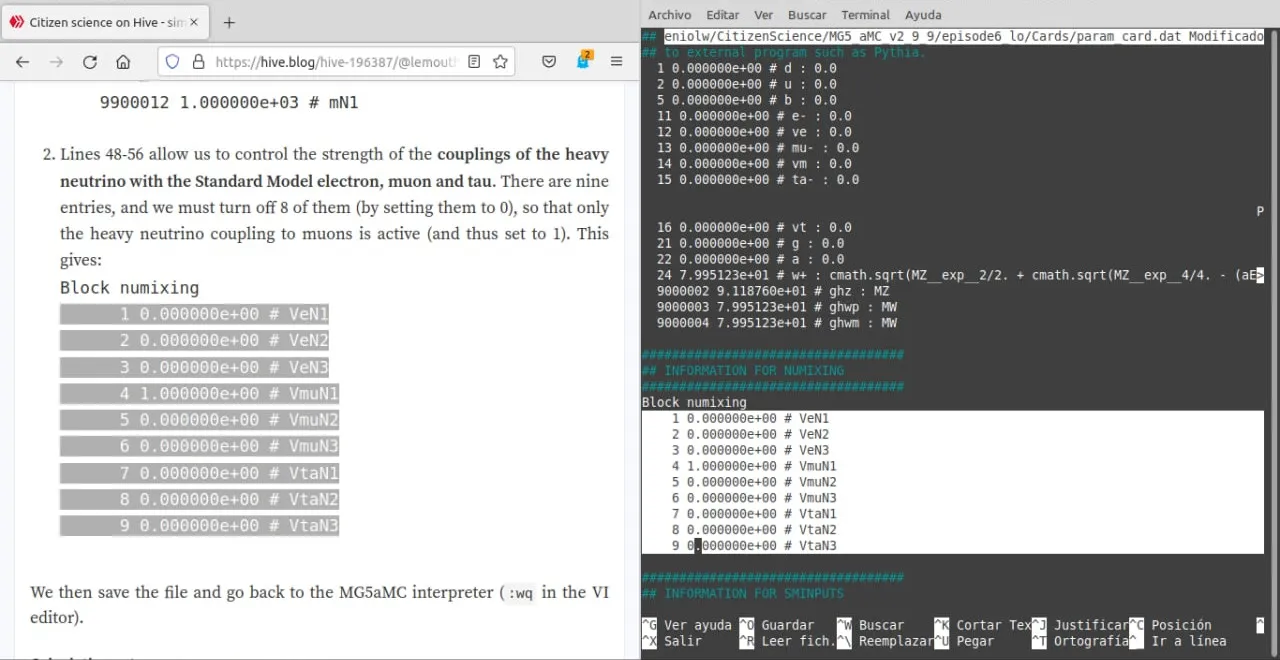
⬆️ Image 2
I also made some calculation adjustments to the run_card according to the instructions, as shown below:
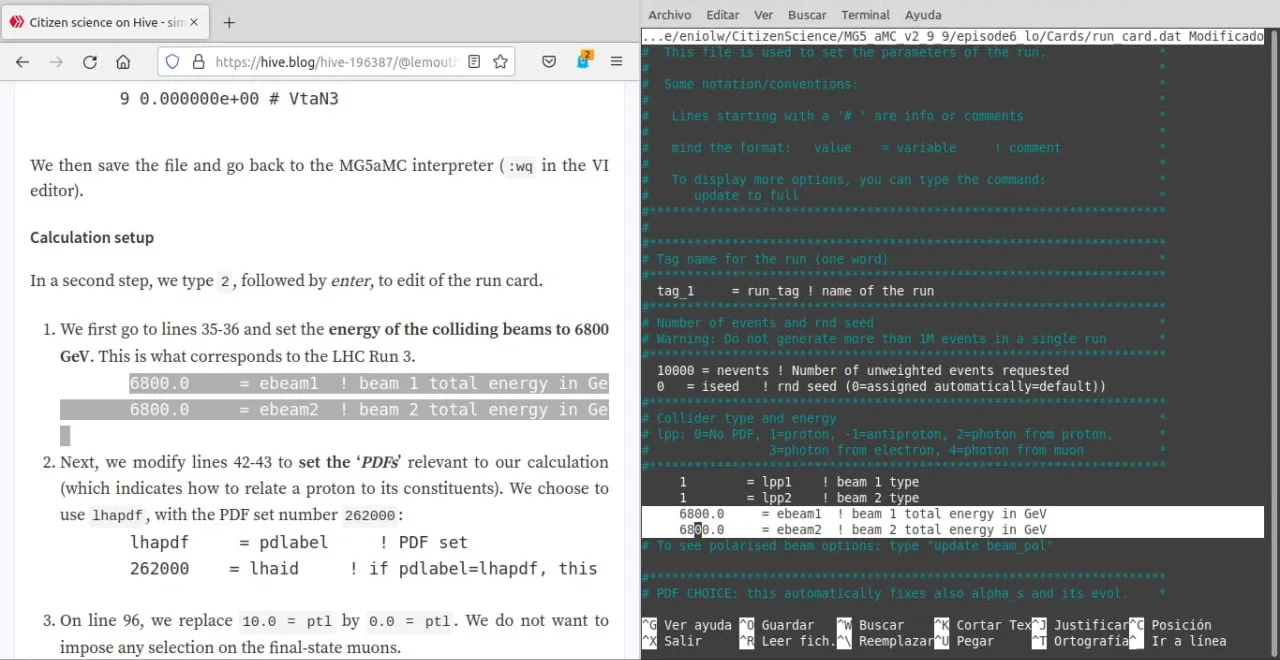
⬆️ Image 3
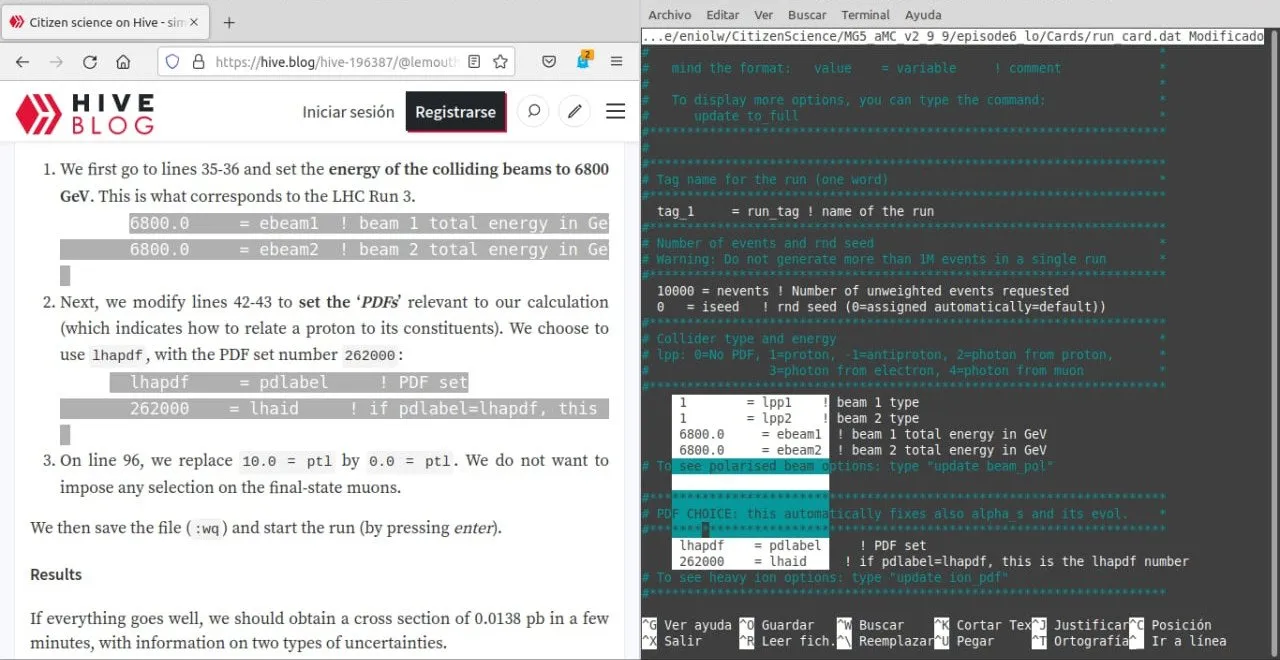
⬆️ Image 4
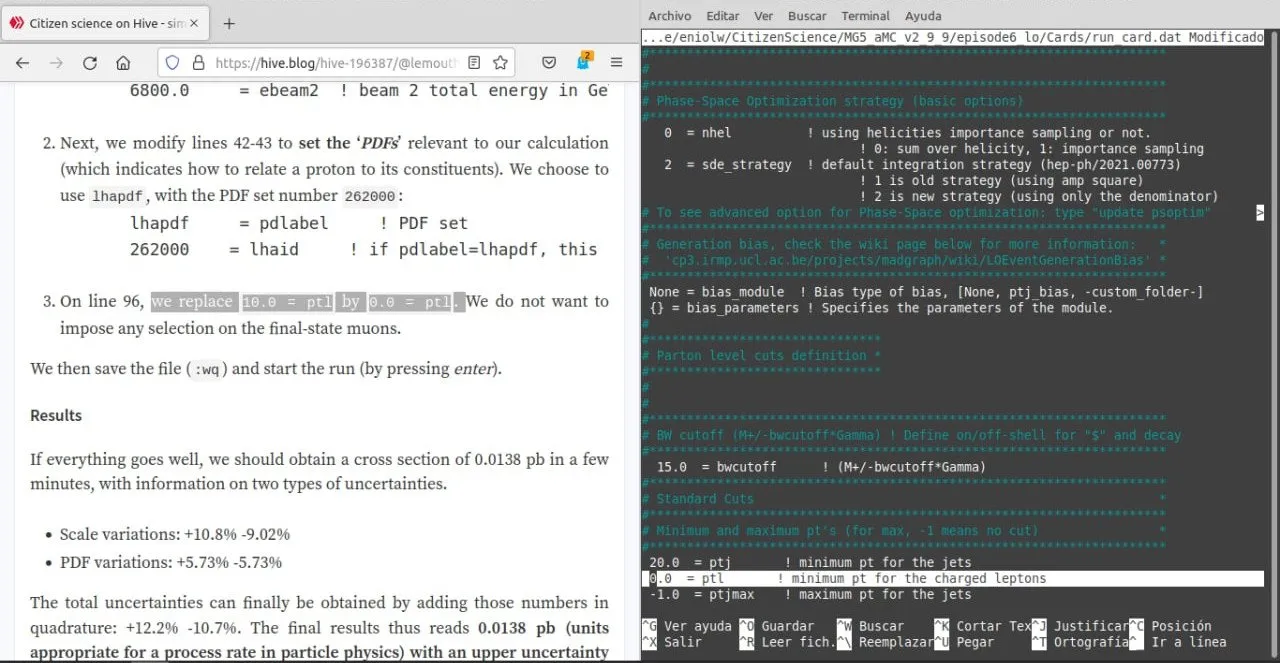
⬆️ Image 5
Now, for some reason the process was failing and reporting this error:
fail
Failed to access python version of LHAPDF: If the python interface to LHAPDF is available on your system, try adding its location to the PYTHONPATH environment variable and theLHAPDF library location to LD_LIBRARY_PATH (linux) or DYLD_LIBRARY_PATH (mac os x).The required LD_LIBRARY_PATH is /home/eniolw/CitizenScience/MG5_aMC_v2_9_9/HEPTools/lhapdf6_py3//lib
I don't know why this happened now and not when I repeated the tasks of episode 5. The truth is that after some advice I managed to solve it by setting the suggested environment variables and the program proceeded to obtain the expected results:

⬆️ Image 6
I also noticed that this report was generated and displayed in the web browser:
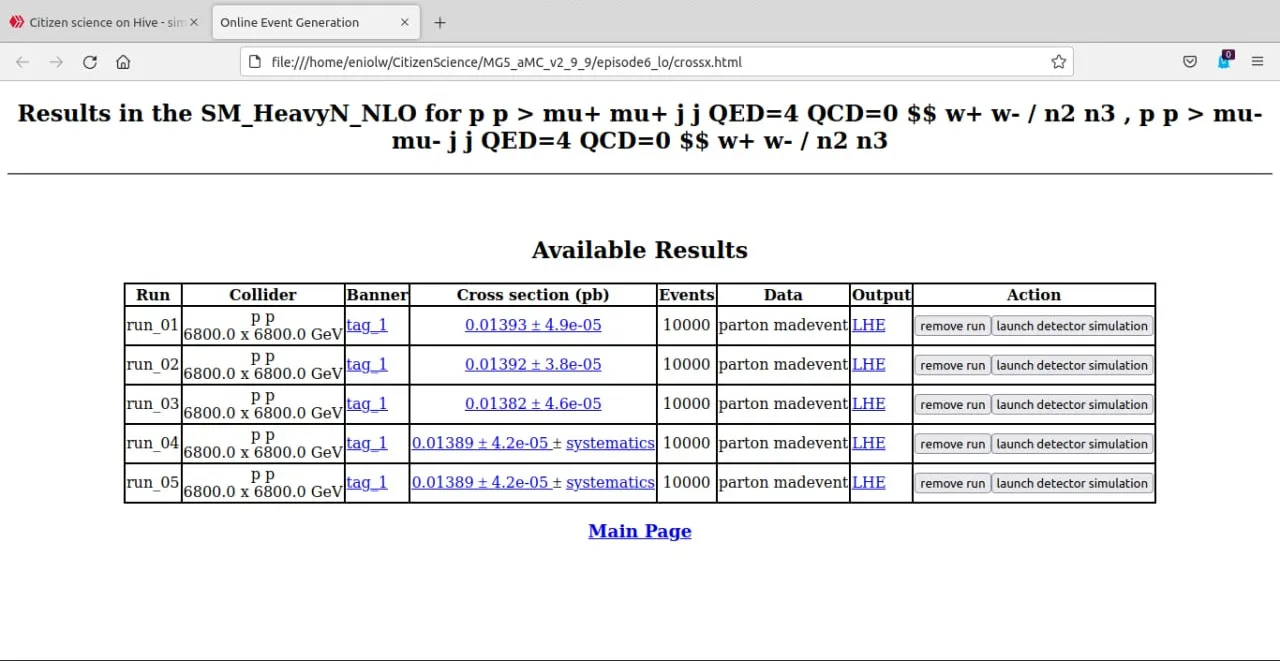
⬆️ Image 7
Assignment
I went on to repeat this entire procedure by changing and adding the values for heavy neutrino masses. In this case, I set the following: 100 GeV, 2,000 GeV, 5,000 GeV, 7,000 GeV, 10,000 GeV, 13,000 GeV, 15,000 GeV, 17,000 GeV and 20,000 GeV for my second attempt at the assignment. This ran the calculations nine times and took more than an hour in total. The results were partially displayed by the standard output and in a text file located at ./MG5_aMC_v2_9_9/episode6_lo/Events/scan_run_[09-17].txt. This file contains the following:
#run_name            mass#9900012         cross
run_09               1.000000e+02         8.597300e-03
run_10               2.000000e+03         7.506200e-03
run_11               5.000000e+03         2.014290e-03
run_12               7.000000e+03         1.116120e-03
run_13               1.000000e+04         5.758450e-04
run_14               1.300000e+04         3.439380e-04
run_15               1.500000e+04         2.579560e-04
run_16               1.700000e+04         2.053140e-04
run_17               2.000000e+04         1.494800e-04
For this assignment we were also asked that with these results we should generate a plot with the heavy neutrino mass being given on the X axis, and the value of the cross section on the Y axis and include an error bar. Using Python 3 and matplotlib I wrote the following script:
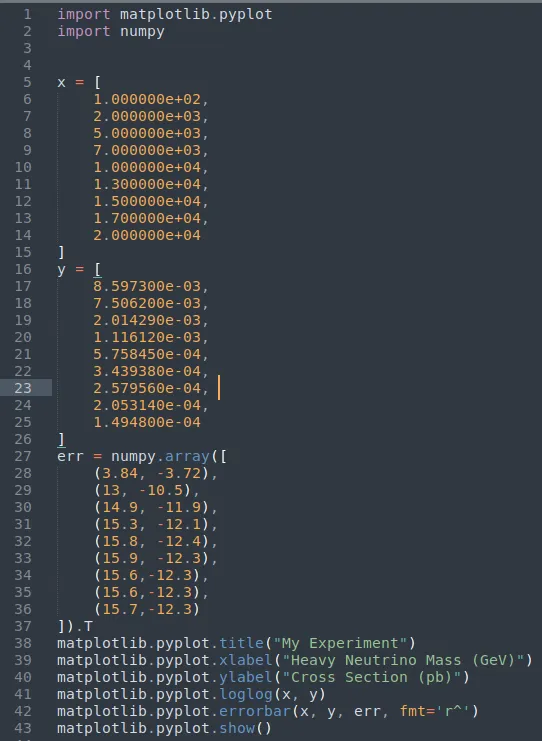
⬆️ Image 8
Once executed, the following graph was generated:
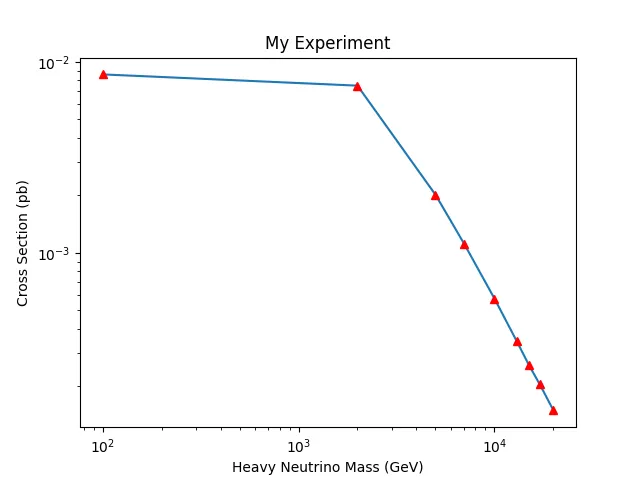
⬆️ Image 9
A plot that with a little autocompletion can be seen to be quite smooth, although I understand that it would have been more convenient to add another point around 20 GeV or 50 GeV. At the moment this is all I have. Thank you for your feedback. See you next time.
Some references
My previous reports
- "Citizen Science" Project Activity Report 1
- "Citizen Science" Project Activity Report 2 - Simulating top quark production at CERN’s Large Hadron Collider
- "Citizen Science" Project Activity Report 3 - Detector Effects and Event Reconstruction
- "Citizen Science" Project Activity Report 4 - Deciphering top quark production at CERN’s Large Hadron Collider
- "Citizen Science" Project Activity Report 5 - Exploring a neutrino mass signal at CERN’s Large Hadron Collider
If you are interested in more STEM (Science, Technology, Engineering and Mathematics) topics, check out the STEMSocial community, where you can find more quality content and also make your contributions. You can join the STEMSocial Discord server to participate even more in our community and check out the weekly distilled.
NOTES
- Unless otherwise stated, the images in this post are the author's.
ES
Reporte de actividades del proyecto "Ciencia Ciudadana" 6 - Simulación de una señal de neutrinos en el Gran Colisionador de Hadrones del CERN con sus incertidumbres
Por Enio...
Resumen
Esta es la sexta entrega del informe de actividades que hago como participante en el proyecto de investigación participativa Proyecto científico de física de partículas en Hive dirigido por @lemouth y realizado por varios entusiastas de la ciencia de la cadena de bloques. Describe las tareas que nos ayudan a simular una señal de neutrinos en el Gran Colisionador de Hadrones del CERN con sus incertidumbres. Las instrucciones para ello se pueden encontrar en este post. Conseguí completar la tarea dada, replicando los resultados esperados, aunque en el proceso obtuve algunos errores inesperados relacionados con las variables de entorno. También realicé la tarea sobre "Dependencia de la tasa de orden principal en la masa del neutrino", restableciendo los parámetros, rehaciendo los cálculos, programando e imprimiendo un gráfico. Agradezco de antemano a @lemouth por la respectiva revisión y consejos.
Tarea 1: Un directorio de trabajo para simulaciones de orden principal
Ya tenía instalado MG5aMC desde los episodios anteriores. Al iniciarlo noté que el programa me informó que había una versión más reciente disponible y me ofreció la posibilidad de actualizar automáticamente, cosa que realicé. Tras eso repetí las tareas del episodio 5 dado que @lemouth me informó que al parecer tenía errores en mis parámetros. Al terminarlas y proceder a realizar las tareas del episodio 6, curiosamente me conseguí con que básicamente había que repetir una tarea del episodio 5. Vaya coincidencia.
En fin, procedí a ejecutar en Mg5:
import model SM_HeavyN_NLO
define p = g u c d s u~ c~ d~ s~
define j = p
generate p p > mu+ mu+ j j QED=4 QCD=0 $$ w+ w- / n2 n3
add process p p > mu- mu- j j QED=4 QCD=0 $$ w+ w- / n2 n3
output episode6_lo
Lo cual generó el directorio episode6_lo. Posteriormente, procedí a ejecutar MG5_aMC>launch a fin de recalcular la tasa de orden principal asociada a nuestra señal. Decidí configurar a Nano como el editor de texto predilecto y seguidamente modifiqué los parámetros del archivo del modelo de neutrinos, como se muestra a continuación:

⬆️ Imagen 1

⬆️ Imagen 2
También hice algunos ajustes de cálculos en la run_card según las instrucciones, tal como se muestra a continuación:

⬆️ Imagen 3

⬆️ Imagen 4

⬆️ Imagen 5
Ahora bien, por alguna razón el proceso estaba fallando e informando de este error:
fail
Failed to access python version of LHAPDF: If the python interface to LHAPDF is available on your system, try adding its location to the PYTHONPATH environment variable and theLHAPDF library location to LD_LIBRARY_PATH (linux) or DYLD_LIBRARY_PATH (mac os x).The required LD_LIBRARY_PATH is /home/eniolw/CitizenScience/MG5_aMC_v2_9_9/HEPTools/lhapdf6_py3//lib
No sé porqué ocurrió esto ahora y no cuando repetí las tareas del episodio 5. Lo cierto es que tras algunas asesorías logré resolverlo al establecer las variables de entorno sugeridas y el programa procedió a obtener los resultados esperados:

⬆️ Imagen 6
También noté que se generó este reporte que se visualizaba en el navegador web:

⬆️ Imagen 7
Asignación
Pasé a repetir todo este procedimiento cambiando y añadiendo los valores para las masas de neutrinos pesados. En este caso, establecí los siguientes: 100 GeV, 2.000 GeV, 5.000 GeV, 7.000 GeV, 10.000 GeV, 13.000 GeV, 15.000 GeV, 17.000 GeV y 20.000 GeV para mi segundo intento de la asignación. Esto ejecutó los cálculos nueve veces y ello duró más de una hora en total. Los resultados fueron parcialmente mostrados por la salida estándar y en un archivo de texto localizado en ./MG5_aMC_v2_9_9/episode6_lo/Events/scan_run_[09-17].txt. Este archivo contiene lo siguiente:
#run_name            mass#9900012         cross
run_09               1.000000e+02         8.597300e-03
run_10               2.000000e+03         7.506200e-03
run_11               5.000000e+03         2.014290e-03
run_12               7.000000e+03         1.116120e-03
run_13               1.000000e+04         5.758450e-04
run_14               1.300000e+04         3.439380e-04
run_15               1.500000e+04         2.579560e-04
run_16               1.700000e+04         2.053140e-04
run_17               2.000000e+04         1.494800e-04
Para esta asignación también se nos pidió que con estos resultados deberíamos generar un gráfico con la masa del neutrino pesado en el eje X, y el valor de la sección transversal en el eje Y, e incluir una barra de error. Utilizando Python 3 y matplotlib escribí el siguiente script:

⬆️ Imagen 8
Una vez ejecutado, se generó el siguiente gráfico:

⬆️ Imagen 9
Un gráfico que con un poco de autocompletado se puede ver que es bastante liso, aunque entiendo que habría sido más conveniente añadir otro punto alrededor de 20 GeV o 50 GeV. De momento esto es todo lo que tengo. Gracias por sus comentarios. Hasta la próxima.
Algunas referencias
Mis reportes previos
- "Citizen Science" Project Activity Report 1
- "Citizen Science" Project Activity Report 2 - Simulating top quark production at CERN’s Large Hadron Collider
- "Citizen Science" Project Activity Report 3 - Detector Effects and Event Reconstruction
- "Citizen Science" Project Activity Report 4 - Deciphering top quark production at CERN’s Large Hadron Collider
- "Citizen Science" Project Activity Report 5 - Exploring a neutrino mass signal at CERN’s Large Hadron Collider
Si está interesado en más temas STEM (ciencia, tecnología, ingeniería y matemáticas), consulte la comunidad STEMSocial, donde puede encontrar más contenido de calidad y también hacer sus aportes. Puedes unirte al servidor de Discord de STEMSocial para participar aún más en nuestra comunidad y ver el distilled semanal.
Notas
- A menos que se indique lo contrario, las imágenes de esta publicación son del autor.