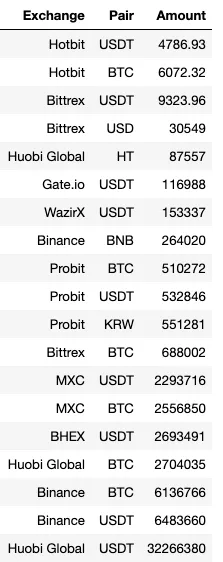
More and more exchanges keep adding to the list but their volume is far away from Huobi and Binance.
Here's the data at the present time.
Current price: 0.4529 USD
Ath price: 0.9705 USD
Ath date: 2020-04-27 at 00:38:45
Volume: 57957207.00 USD
The price seems to finally hit a local bottom and has been trading around $0,5 for the past hours. The following days will show us if the market is able to start up-trending again or will enter into a trading range.

The volume graph shows a minor increase during the past hours but not too significant to reverse the tendency line. We have been in the 50M range during the past hours.

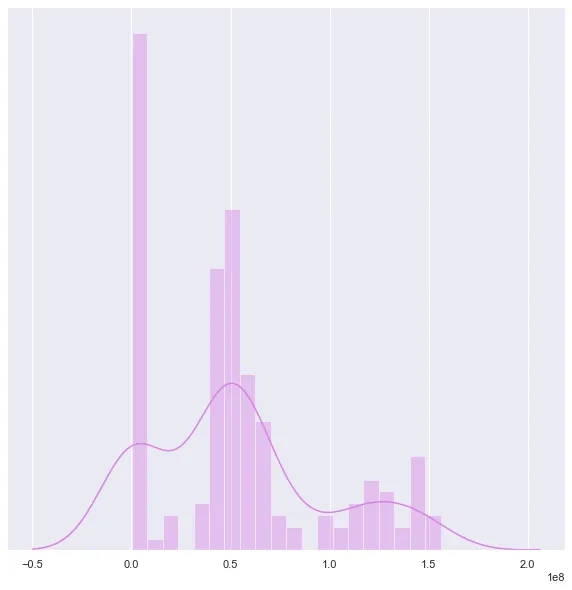
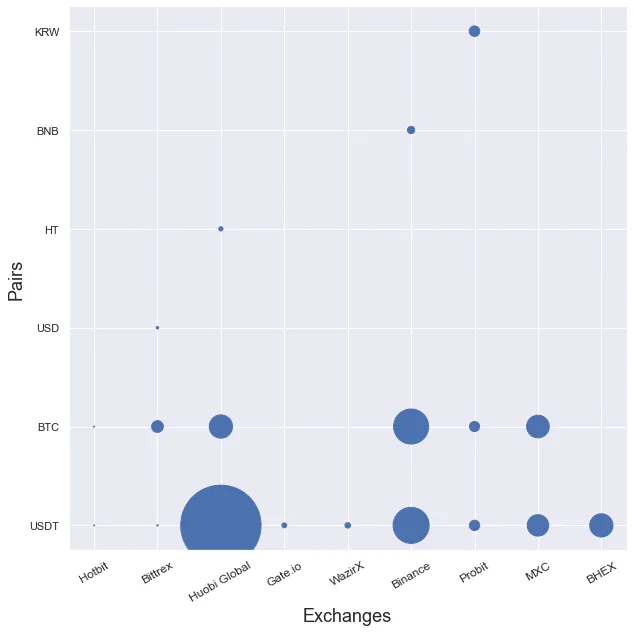
I have decided to sort the data by volume so it is easier to find out the different amounts from pairs and exchanges. As you can see in the data and the graphs, the volume level of Huobi and Binance is way bigger than the rest. The histogram keeps growing the bars in the middle as more and more hours have a volume in the 50M range.


Histogram and volume Bar graphs get too much skewed
| Volume Histogram | Volume Bubble Graph |
|---|---|
 |  |
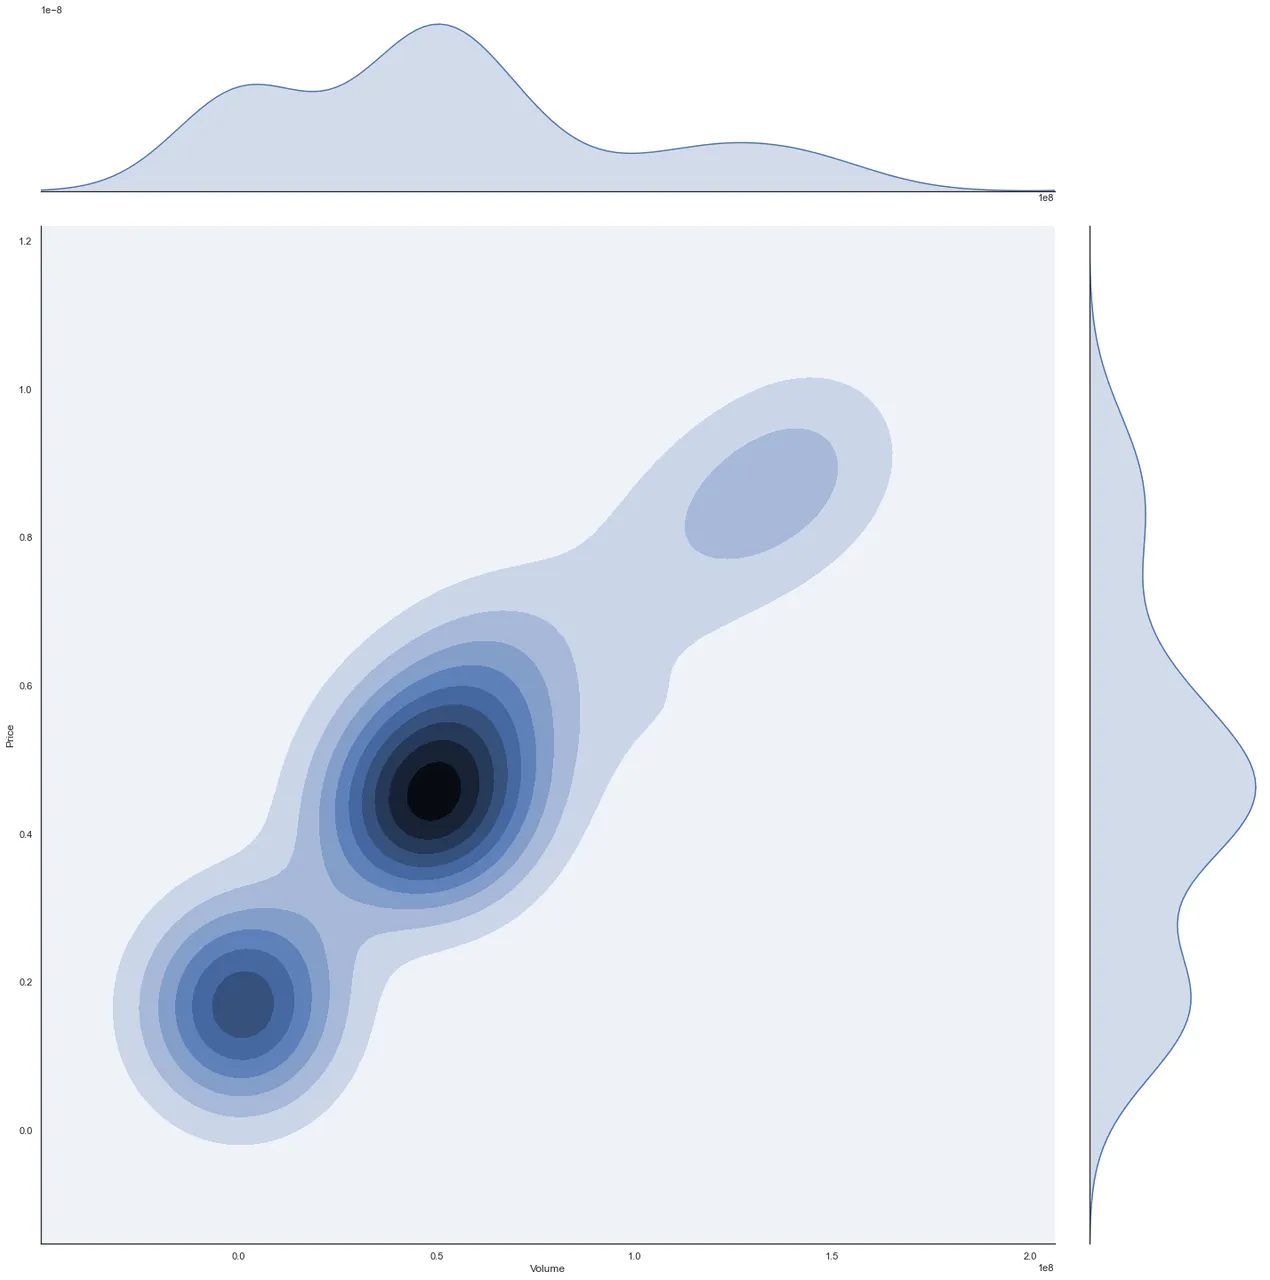
Finally, the density plot clearly shows how the middle area corresponding to the 50M/$0,5 is becoming the most important. If the market does not move we will end up with just that area in the graph.
Density Plot

Data extracted from Coingecko