Two new exchanges added today making a total of 18 pairs, but the price is experiencing a strong retracement and is struggling to remain above $0,5.
Here's the data at the present time.
Current price: 0.4962 USD
Ath price: 0.9705 USD
Ath date: 2020-04-27 at 00:38:45
Volume: 49157599.00 USD
Yesterday, the price bounced up after reaching the 50% retracement line, but today it went further down reaching 68% Fibonacci line. Let's expect this time it can hold. The tendency line clearly shows the retracement.

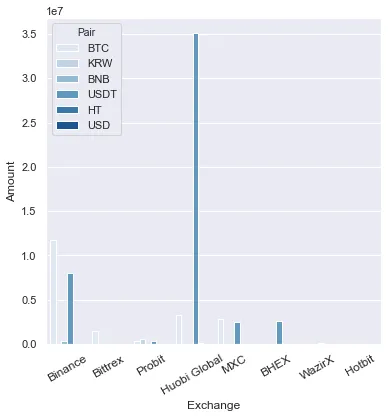
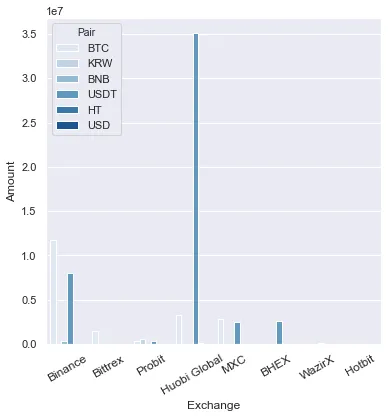
The volume graph also shows a volume decline even though additional exchanges keep adding. Huobi has such a strong volume that it influences the chart with its changes. We are around 50M trading volume today.

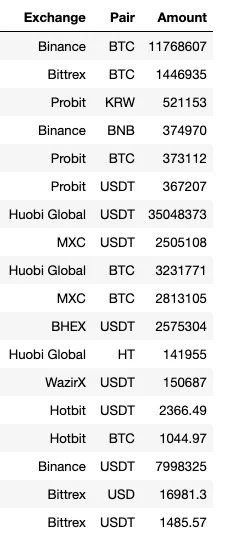
Although we have already 8 exchanges trading Hive, the reality is that Huobi Hive/USDT pair leads the volume by far, and only Binance has significative volume compared to Huobi. The rest of the influence of the exchanges in total traded volume is irrelevant. You can see the bars in the Volume Bar Graph.
| Exchanges Data | Exchanges Graph |
|---|---|
 |  |
Histogram starts to add data to the bars in the $0,5 area.
| Volume Histogram | Volume Bar Graph |
|---|---|
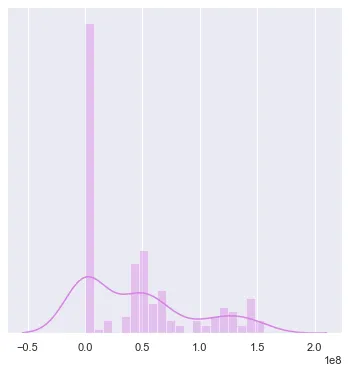 |  |
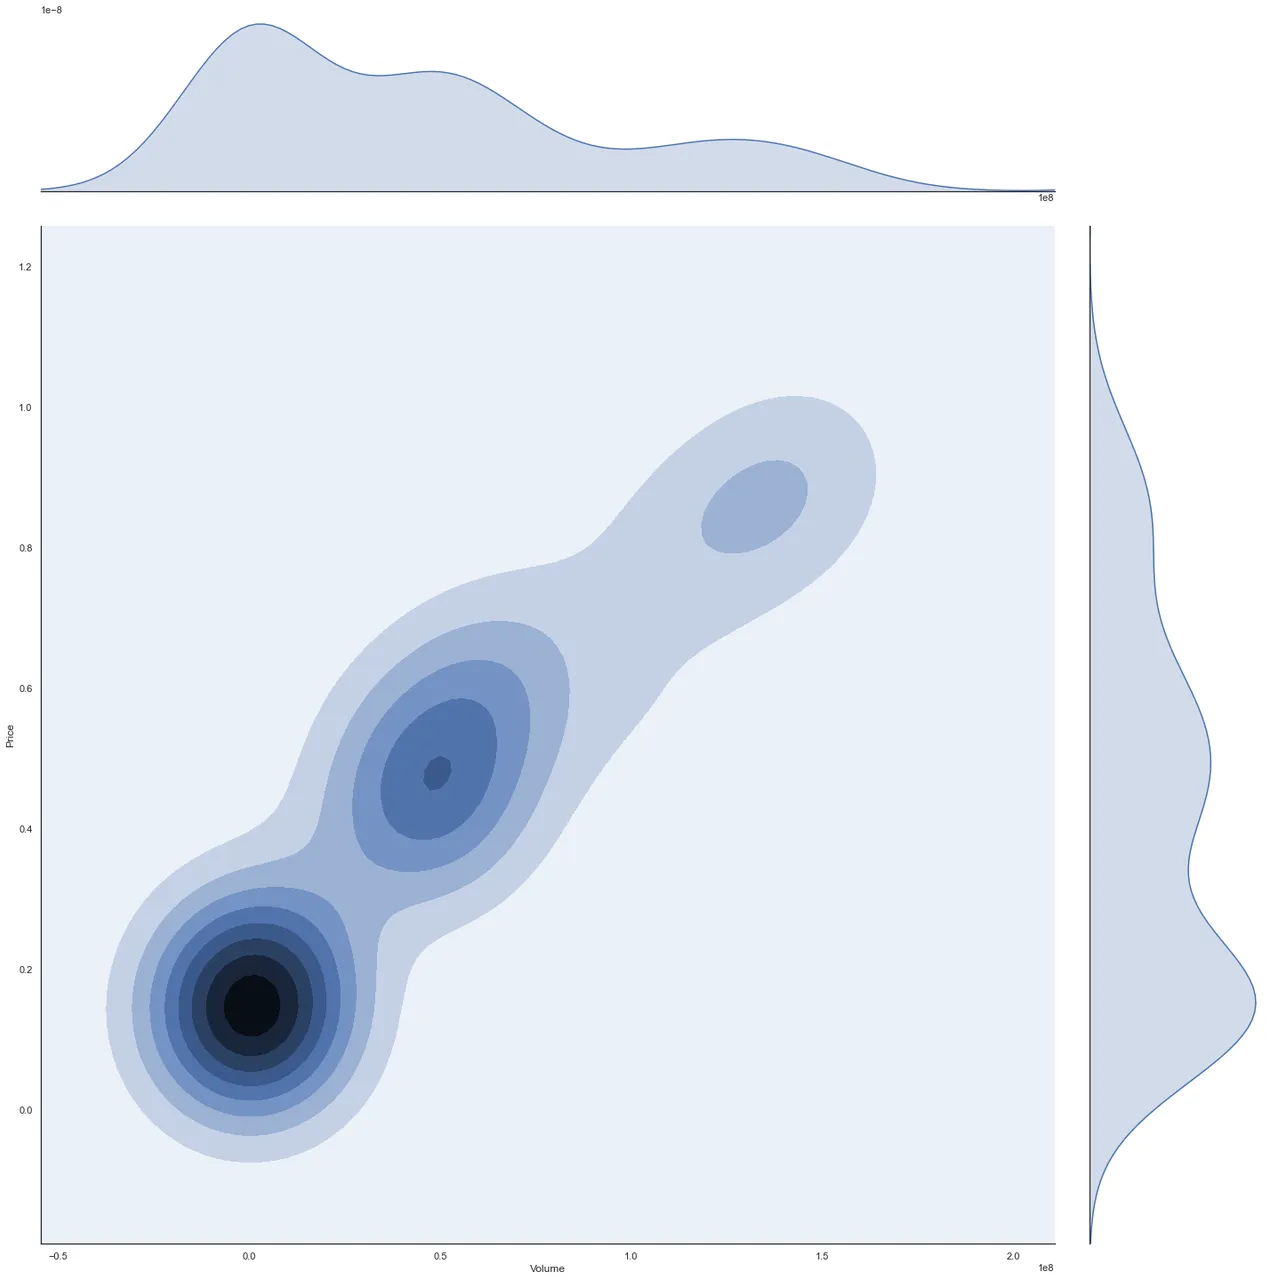
Finally, the Density plot has managed to connect the three trading areas. As the market remains in the $0,5 area, more and more data is plotted in the middle area of the graph. It will be interesting to see if the top area disappears or if market manages to move up there again.
Density Plot
Data extracted from Coingecko