Hello, dear members of LeoFinance!
Today I would like to point out one very interesting formation on the price chart of Ontology.
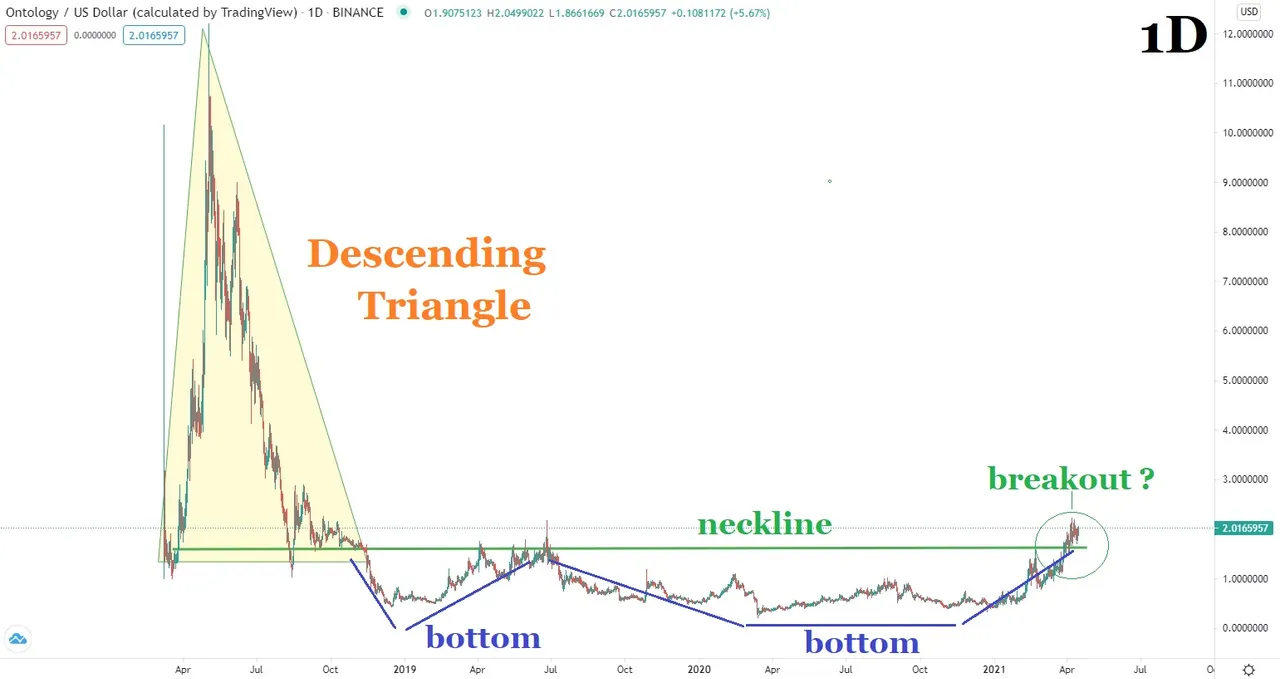
In the daily chart (1D), ONT/USD has formed something similar to Double Bottom (common trend reversal pattern):

As can be seen from the chart, right now, ONT/USD is testing the horizontal line that used to be the key support level (corresponding to the lower bound of the Descending Triangle) during the beginning of the Bear Market in 2018.
In my view, if a breakout takes place then we may witness the beginning of the trend reversal.
To be continued ...
As of the time of writing, one ONT costs approximately $2,02 on the Binance crypto exchange, according to TradingView.
A few words about me:
Just to let you know: I've been working professionally as a currency analyst for last almost 15 years, and as a cryptocurrency analyst for last almost 4 years.
Important!
Keep in mind, that thoughts expressed here are my own, and they should not be regarded as recommendations for any cryptocurrency/commodity trades, investments and etc.
Learn How To Earn PRE Tokens By Using Presearch Decentralized Search Engine
Join the crypto exchange Binance: https://www.binance.com/en/register?ref=28017531
Join the crypto exchange Bittrex: https://bittrex.com/Account/Register?referralCode=3GB-QAJ-BMW