Hello Hive,
Hope you are doing well. :)
This is my trade from yesterday, Monday 1/31/22. I trade only on SPX, which is the symbol for the S&P 500, a big composite of the top 500 stock companies. I trade stock options, which are not the stocks themselves, but a derivative of stocks.
This is a snap of marketwatch. It's my broker's (TD Ameritrade) own indicator from their platform (thinkorswim). The colors represent movement of price.. green is showing that prices are going up, and red shows price is dropping. The more intense the color, the greater the movement. Also, the different sizes of those boxes shows how big the company is.
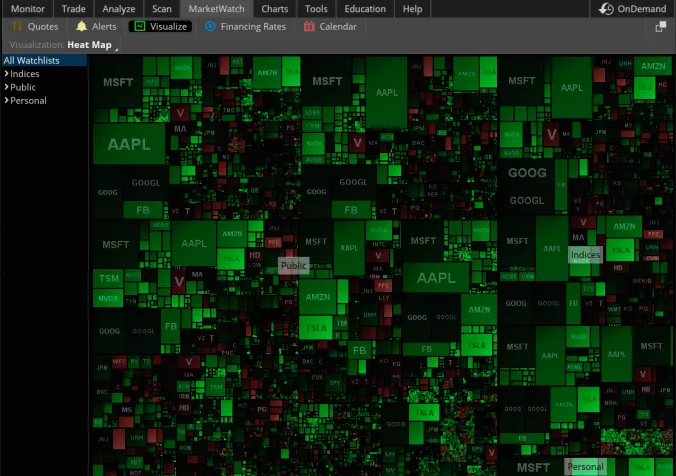
It's mostly green so it's telling me that the market on a whole is moving up. This agrees with what I can see just by looking at how price moved all morning. I need to use a strategy that will profit from a continued rise in price. (or at least the price will stay where it is) I used a Put Credit Spread (PCS). All that means is I sold an option at a price lower that current price and then bought another option below my first option.
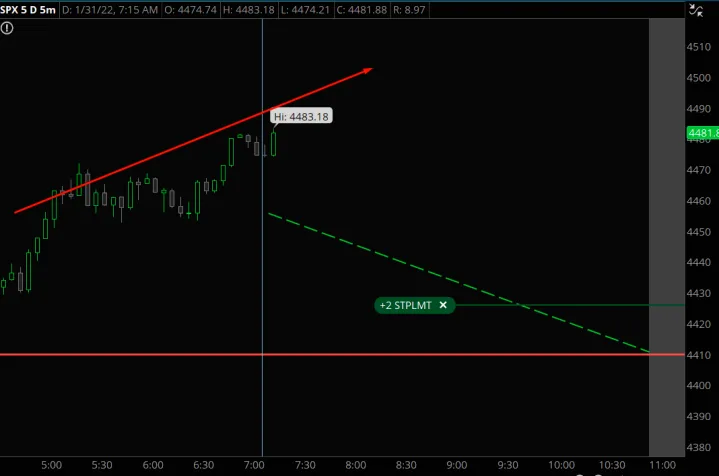
Here is my filled order..

One thing I look at to determine the volatility of the market is the VIX, volatility index. It was high that morning..
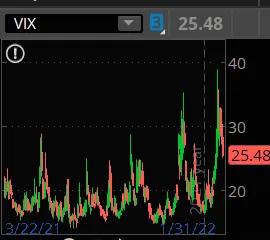
A normal range is about 16-20. So a VIX higher or lower than that needs some adjustment in the wingsize (distance between sold option price and bought option price). Notice that I chose to go much smaller with just a 15 wide PCS. I usually go with a 25 wide.
Here are some snaps of the chart I took as the trade progressed..
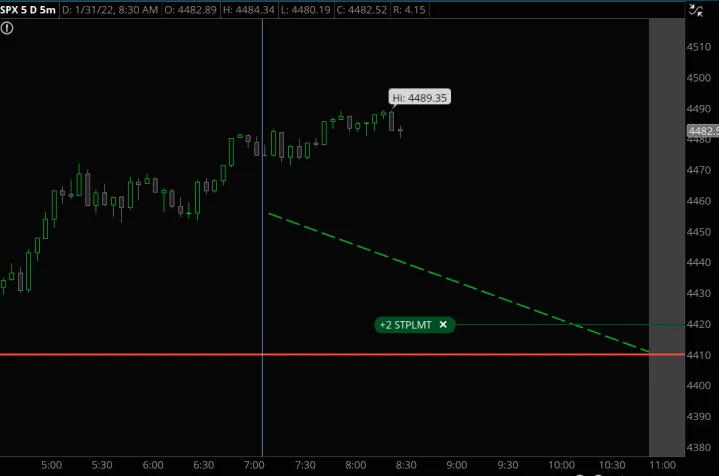
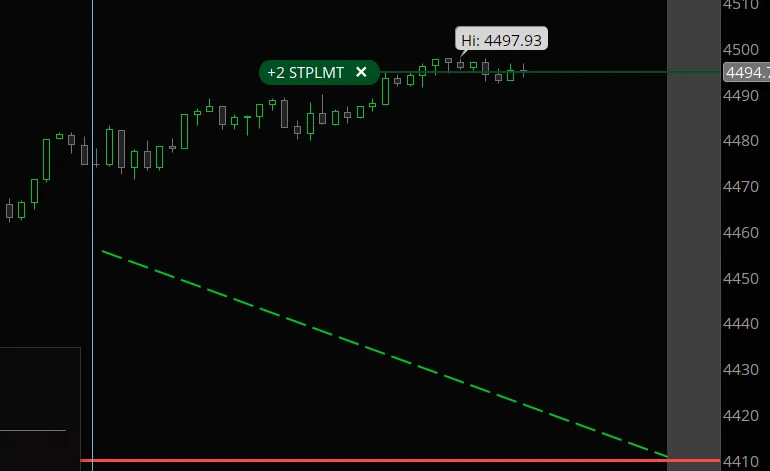
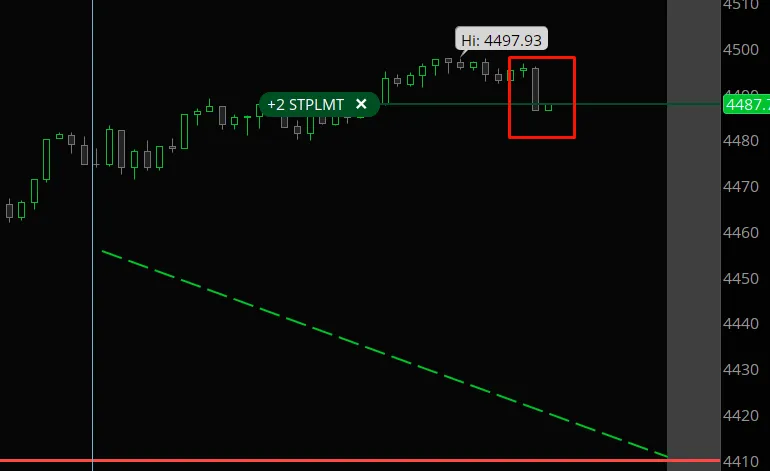
I drew a red box around recent price action to show how it dropped fast and hard, yet due to the fact that the longer my trade goes on, since I am selling the option and not buying, I actually gain from option decay, and so my safe zone gets bigger. If this same price drop had occurred in the beginning of the trade, it might've stopped me out.
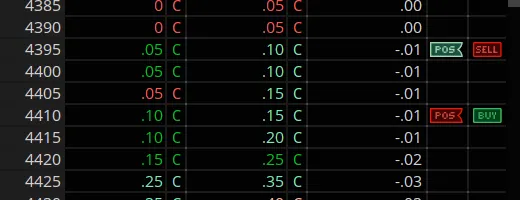
I like to watch the delta of a trade. It shows the percent chance of a price level getting touched. If you subtract this from 100, you get the trade POP (probability of profit) which is the % chance (so says the broker.. it's never certain).. .01 means 1%, .02 is 2%, etc. So, the lower, the better.
This was the delta at 8:36a, shortly after I started the trade..

(the delta is the fourth value in white)
Here it is again at 10.11a
and finally, this is how the trade ended..
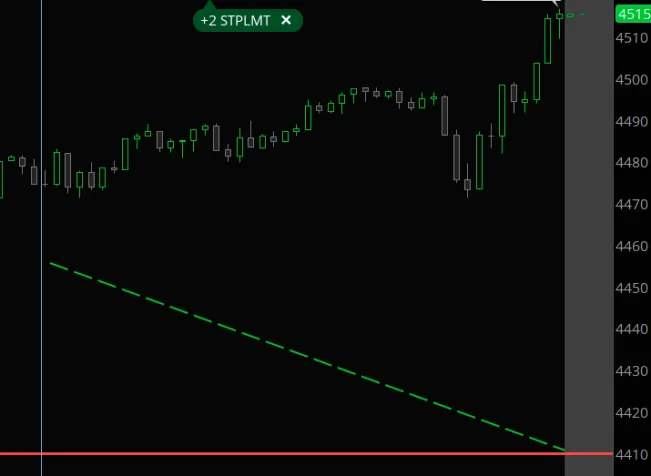
The result of the trade: (since the trade ran until the end, it expires worthless, which means I get to keep the entire credit I received for selling it, plus it saved me one commission and exchange fee since I didn't have to close it.. the broker does that automatically.)
$100 (2 contracts X .50 which is $50) - $4.38 (comm+fees) = $95.62
I know it might be confusing to some people, so feel free to say any question or comment.
:)