The party continues as the price seems to have no ceiling. It will be interesting to see if it is able to reach $1 and if that amount will be a resistance making the price rebound.
Here's the data at the present time.
Current price: 0.7450 USD
Ath price: 0.6933 USD
Ath date: 2020-04-26 at 10:15:25
Volume: 85204993.00 USD
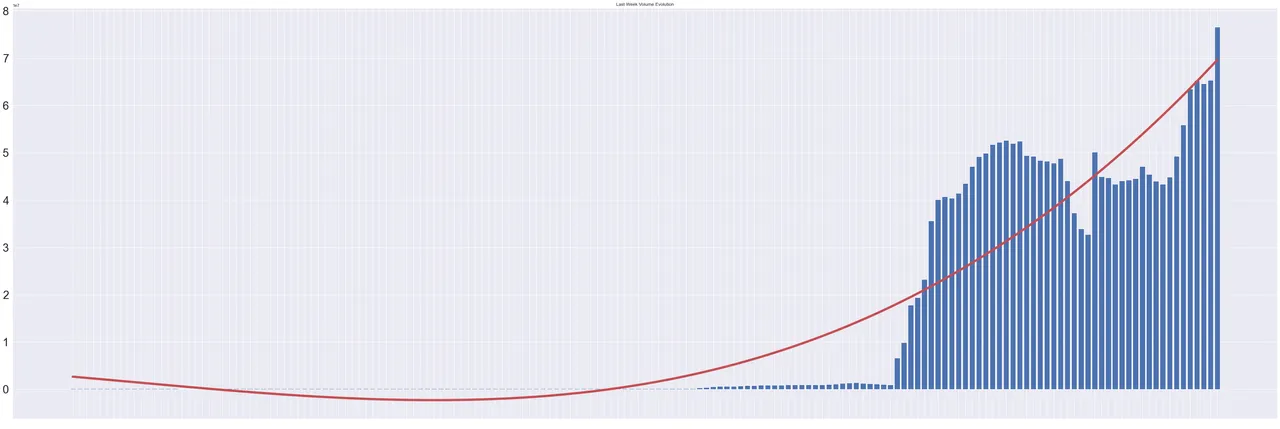
The price raised keeps steadily up-trending with some retracements after every up leg. Again, graphs represent only one week of data in order to get nicer images. As you can see, the trend line does not even show evidence of a reversal.

The volume graph amazes me even more than the price one. It keeps growing and growing approaching the daily 100M amount.
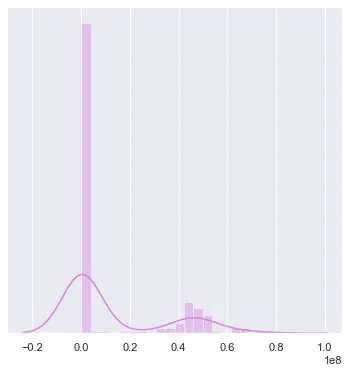
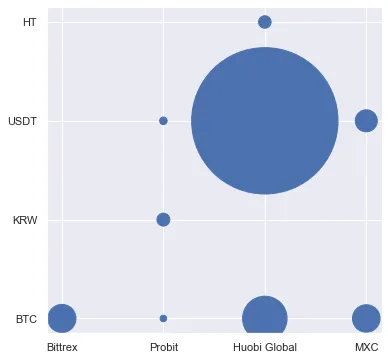
Huobi Hive/USDT pair just stands out of the rest or exchanges and pairs. It will be interesting to see if volume from other exchanges tries to get closer to the amounts Huobi is dealing with. All in all, the tendency line again shows just uptrend. I decided just to show the table data and the Buble graph as the bar chart is so skewed it has no sense at all.
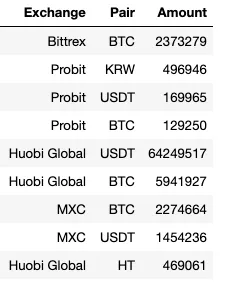
Histogram and volume Bar graphs get too much skewed
| Volume Histogram | Volume Buble Graph |
|---|---|
 |  |
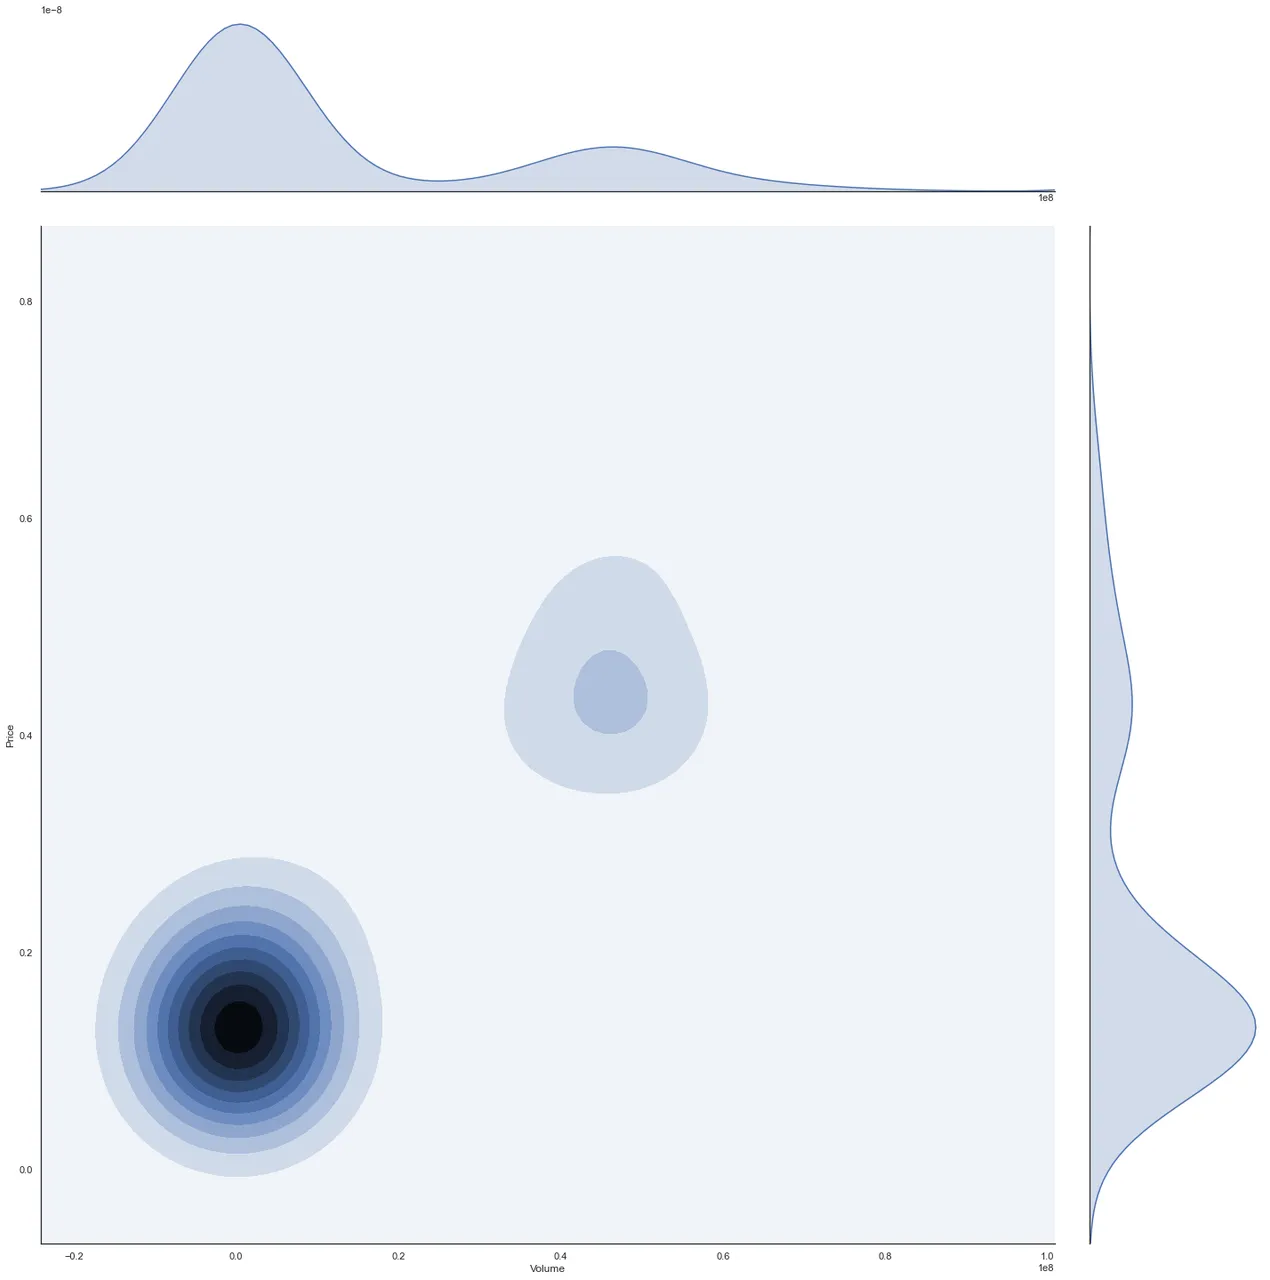
Finally, the density graph starts to grow the upper area but interestingly as the price keeps growing, the shape of the area resembles an egg or a pear, as it keeps adding values to the upper side of the new area.
Density Plot
Data extracted from Coingecko