We are approaching the end of the month and WHAT A MONTH we are having.
Today I adjusted the amount of data in some of the charts so they show nicer representations.
Here's the data at the present time.
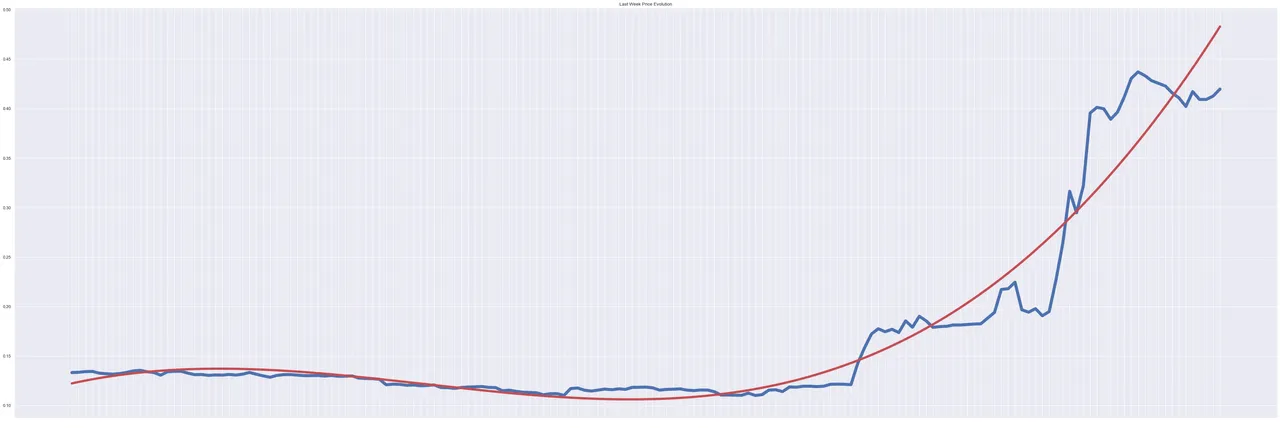
Current price: 0.4198 USD
Ath price: 0.4381 USD
Ath date: 2020-04-24 at 22:48:54
Volume: 48642025.00 USD
The price managed to maintain the high values it reached yesterday. It keeps the $0,4 level and if it is able to do so for the whole weekend the level will probably be consolidated. There is only 7 days represented today, it is enough to see the spike effect.
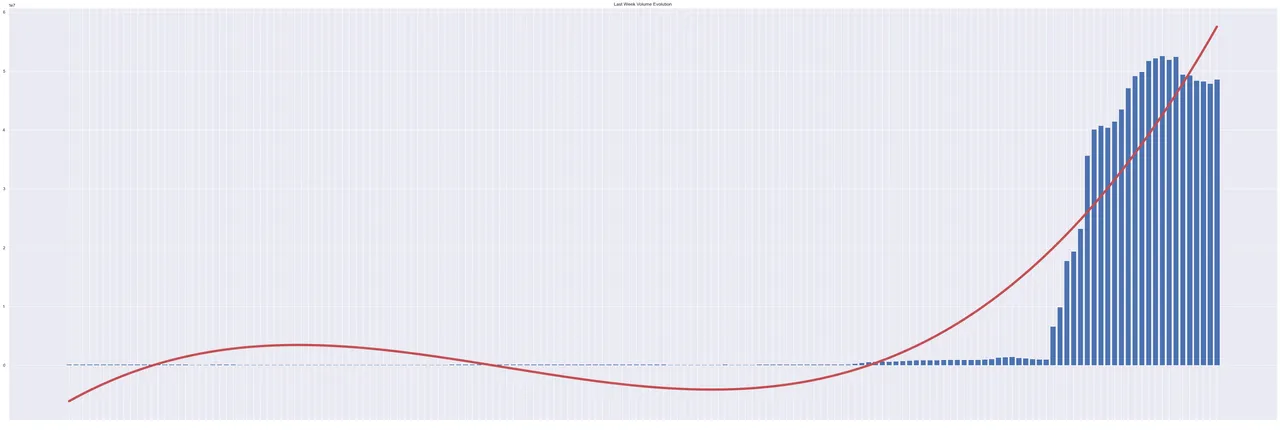
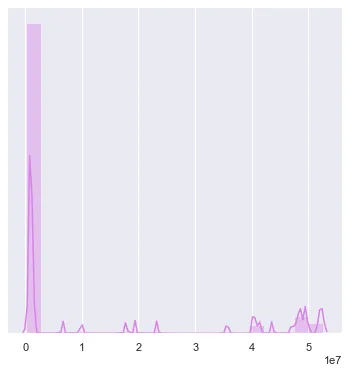
The volume increase is just unbelievable. I have also represented only 7 days here but we have passed from 200K a day to 50M a day. It just broke the chart!.
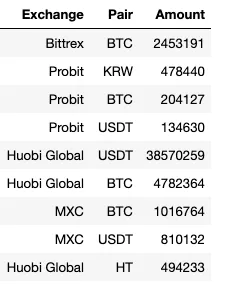
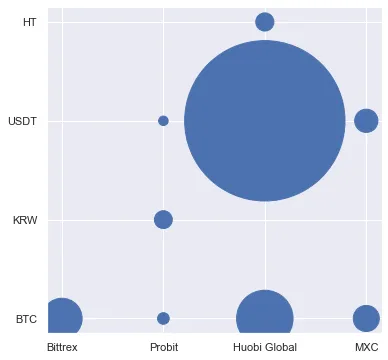
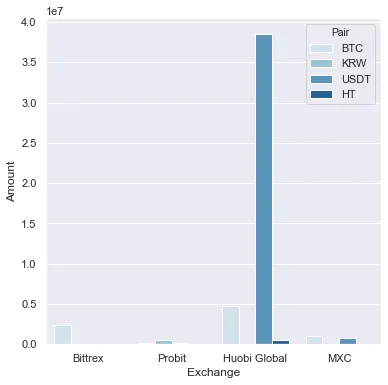
Huobi Hive/USDT pair is by far the one with biggest volume. Only Bittrex and Huobi Hive/BTC pairs also have reasonable volumes although there is a huge distance. The rest of the markets and pairs are essential as a way to offer market participation but all trends are led by Huobi USDT. You can appreciate that huge difference in the exchanges bar graph further below.
| Exchanges Data | Exchanges Graph |
|---|---|
 |  |
Histogram and volume Bar graphs get too much skewed
| Volume Histogram | Volume Bar Graph |
|---|---|
 |  ) ) |
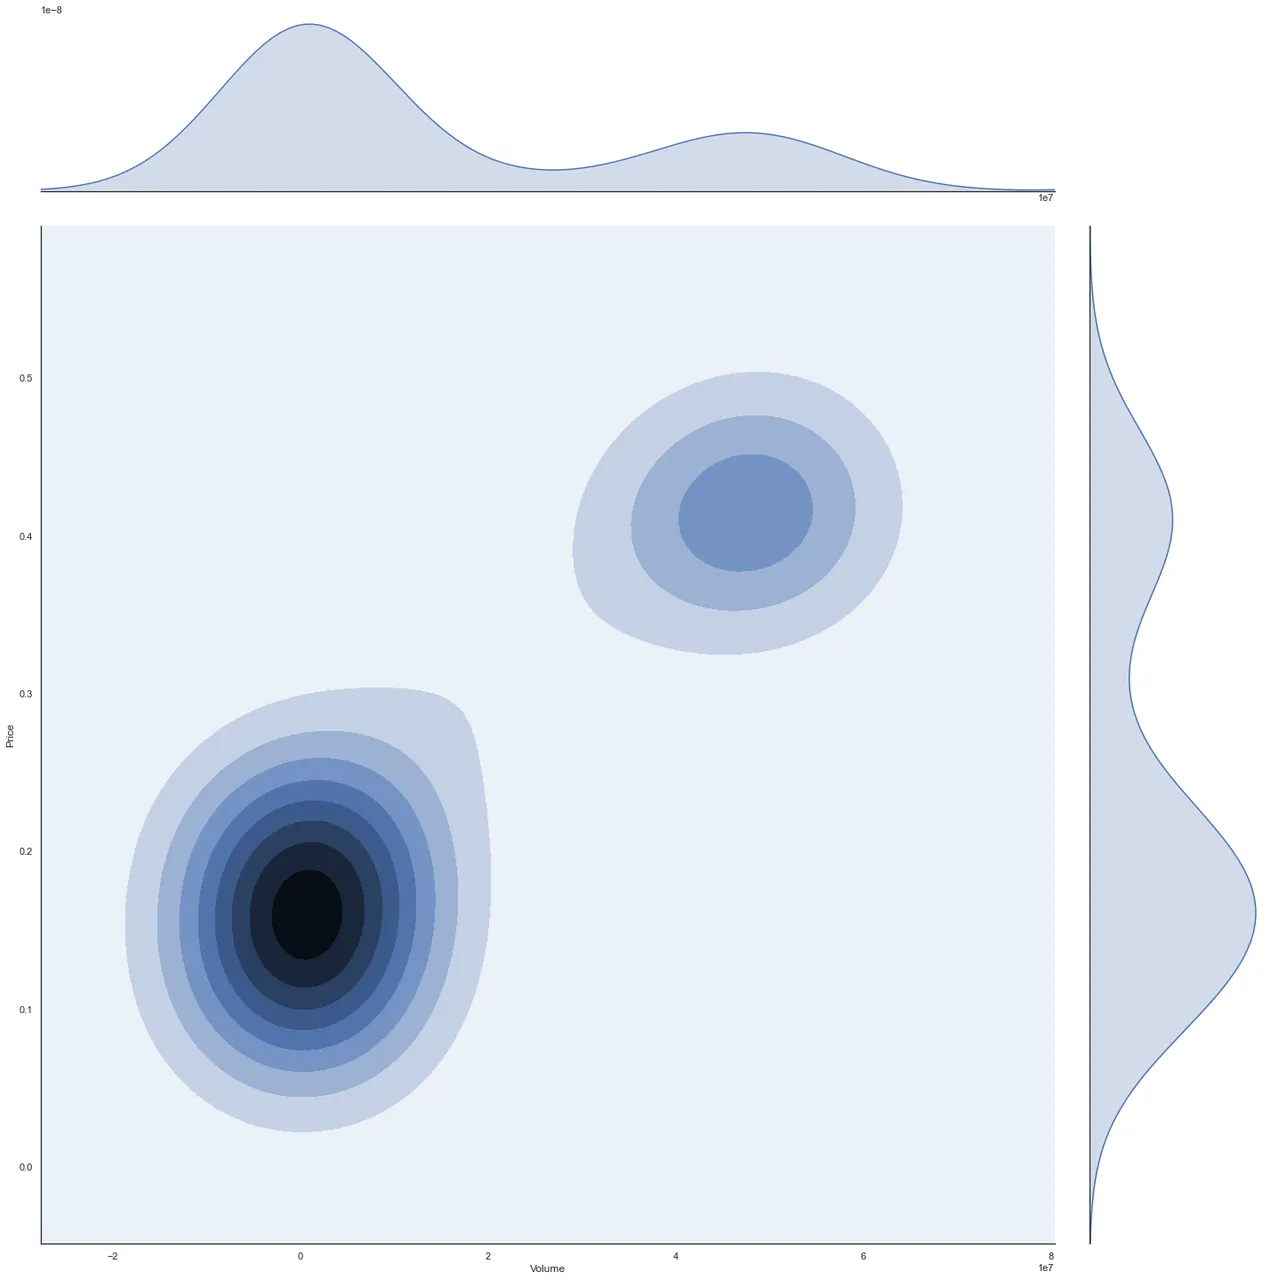
Finally, like yesterday, I have only used 3 days for the Price/volume density plot. Today the image is much better and clearly shows the two trading areas. Expect the upper/right one to keep gaining data as days go by.
Density Plot
Data extracted from Coingecko