Patience is needed in any bear market. Oh, and don't forget about discipline. Patience to know that a bear market has the ability to get worse when you think it can't and the discipline to hold and have cash ready at hand.
The below chart is a short term perspective for STEEM. The Inverted H&S pattern is expected to act out and serve as the base from which an impulse sequence should start. I believe the mid $0.45 to $0.55 are potential as price across Cryptosphere should rise into mid January.

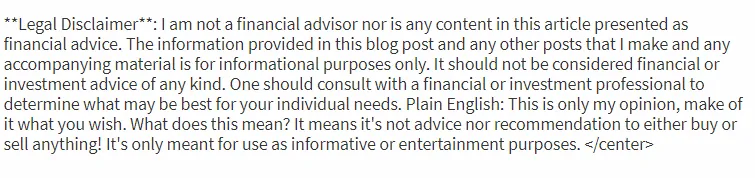
However, by January 17 to 21st; one more hit to the downside is expected. The below chart shows a daily cycle analysis for STEEM. The red arrows are the peaks and the blue are the troughs. The trough to trough length is running at 75 to 104 days. The recent low was likely the end of old and start of a new cycle. In a bear market, the cycles are left translated or they peak prior to the midpoint of the cycle. In other words, less time is spent on rising while more time is spent on declining.
IF the rise into mid-January is a three wave swing as shown by the red ABC, then a new lower low is likely...perhaps to $0.18 to $0.15. Again, this is if the rise into mid January is a three wave swing.
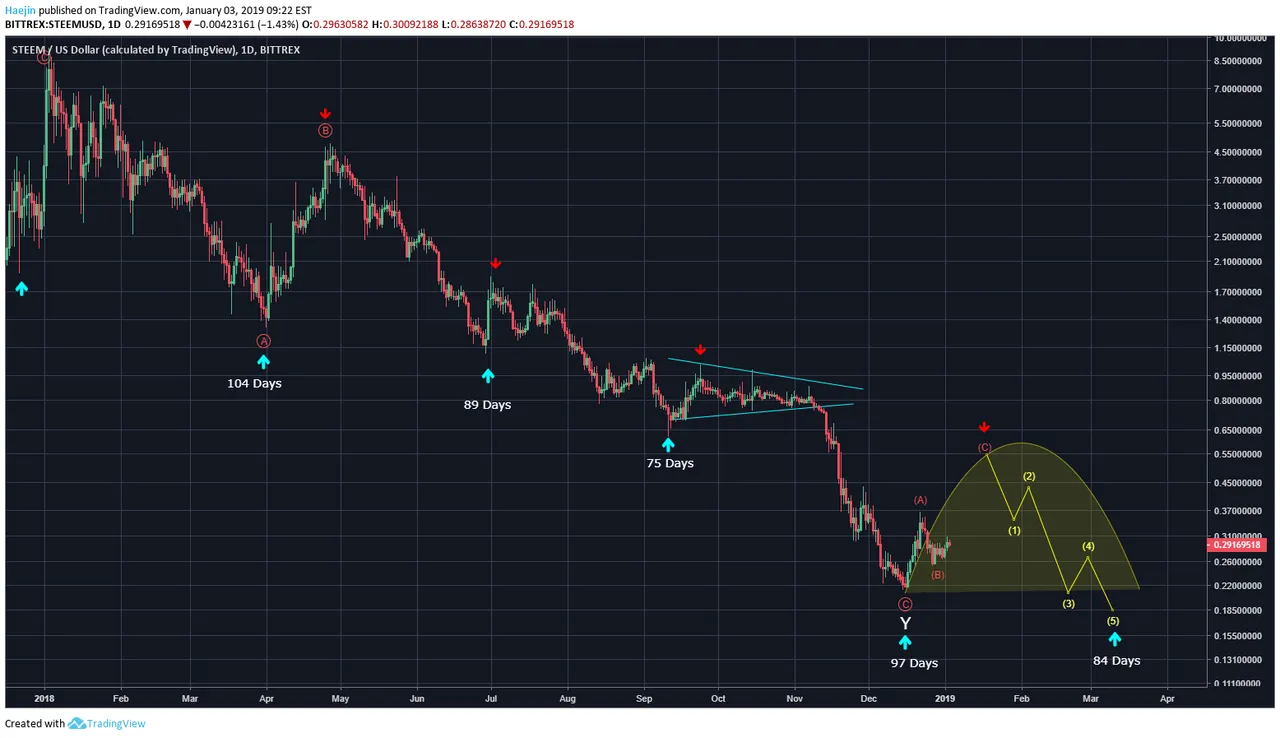
IF the rise into mid-January is a five wave swing as shown in the below chart, then the coming decline as shown by the red ABC would generate a higher low. This would indicated that a new impulse sequence is likely.
Both scenarios will occur within the cycle time span but can stretch +/- a few days.