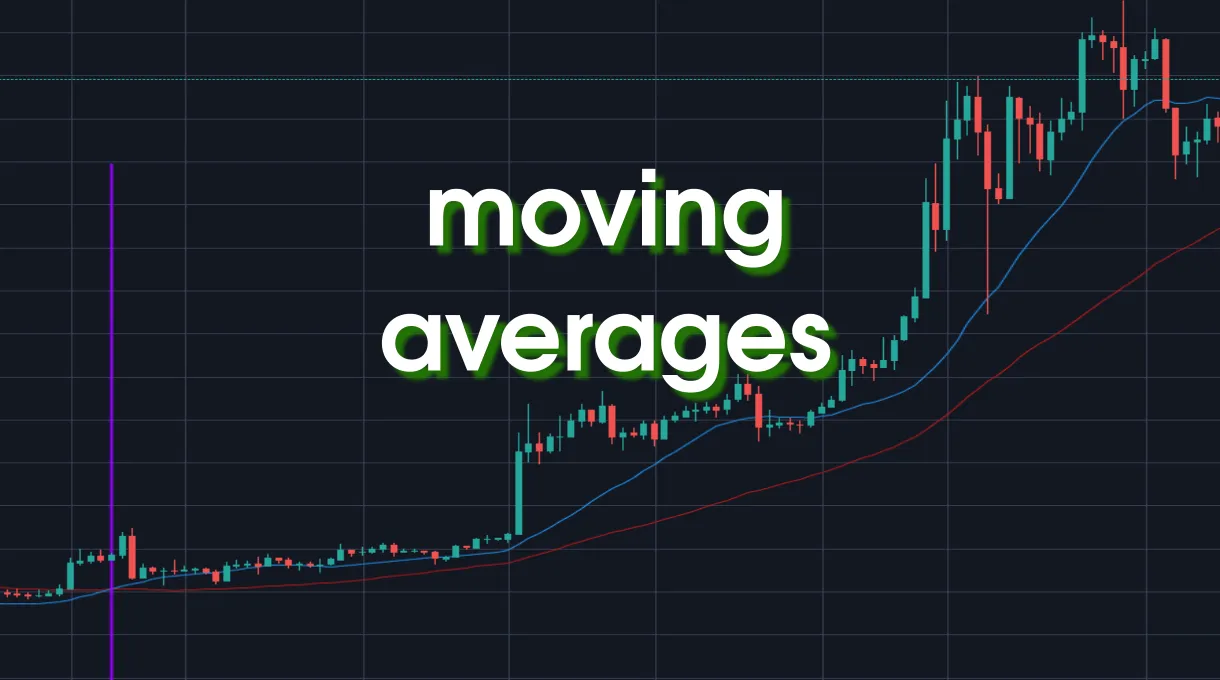
Moving averages are a popular instrument used by traders to evaluate market trends. But what is a moving average? It is very simple, actually. First thing to know is that moving averages (MA) always have a period parameter. This is the number of periods (in this article we will stick to days) with respect to which we will calculate the average. So, for example, a 20-day MA is simply the average price of an asset in the last 20 days. A 50-day MA is the average price in the last 50 days, and so on.
So, what is the point of using such instruments? Imagine that you want to buy BTC, for example, but you set your criteria to be that you want to buy only if it is "cheap", relative to this year's price. Well, then you just need to look at the 365-day MA. If the current price is above it, it means it is expensive relative to this year's price, if it is below, it's cheap.
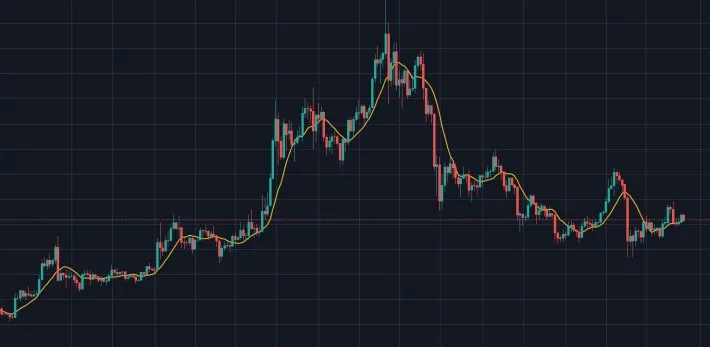
Of course, that criteria is very simplistic and should not be your only way of deciding, but using the MA can help to have a quantitative notion in those cases. More than that, a moving average is a way of smoothing the price curve, which is useful specially in the cryptocurrency market where prices vary wildly. If you want to "remove noise", a good technique is to use a moving average. For example, look in the image below how the 10-day moving average makes the ETH/USD price chart smoother.
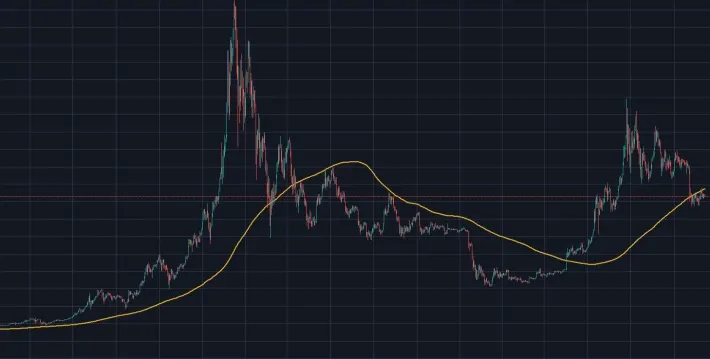
Moving averages represent can represent short, middle or long-term trends. For those, we use 10-20 days, 50 days and 100-200 days, respectively. For example, look in the figure below the long-term trend for the BTC/USD price, using a 200-day MA. Notice also how the MA serves often as support and resistance.
A very common technique to use with moving averages is to look at crossings between MAs with different parameters. For example, if we plot the 20-day MA and the 50-day MA, we will have two trend lines: the short-term and the long-term trends. Below, the red line is the 50MA and the blue line is the 20MA. The idea is that, when a short-term trend line crosses a long-term trend line upward, it means that the market is entering in bullish territory, that is, the short-term trend is beating the long-term trend, which means that prices are predicted to rise -- because they have been rising steadily. The opposite is true if the short-term line crosses below the long-term line -- a bearish sign. In the figure below, the crossing of the 20 and the 50 MAs signals an entry point: time to buy!

I have been experimenting with these MAs to see if they actually work. Obviously they are not 100% guaranteed to give good signals, otherwise trading would be very easy. But perhaps they have higher than 50% chance of being right, which already makes them useful. I have 3 test cases. First, Bitcoin:
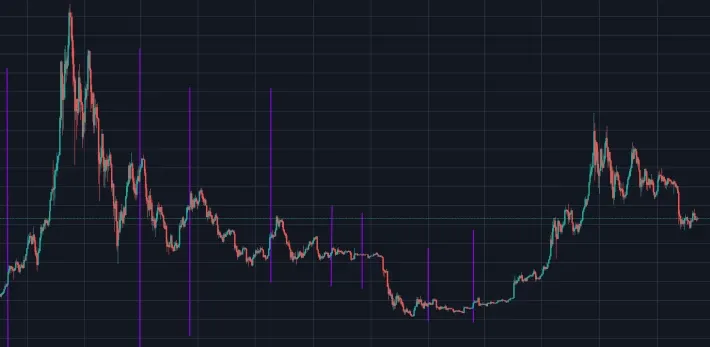
The purple vertical lines represent buy signals, according to the crossings of 20 and 50 MAs (I removed the MAs to make it more readable). We can see that not all of the signals were very successful in this case. The chart below, for BAT, is a bit more successful: 4 correct signals, 1 still inconclusive and 2 wrong ones.

The chart for Chainlink (LINK), though, is impressively correct:
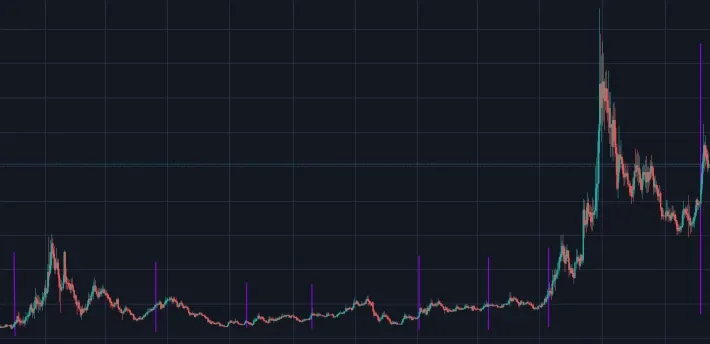
Basically we have a 100% of correct signals using 20 and 50MAs. I don't know yet what to think of this, but it seems that, if used with caution, the crossing of MAs might be a good indicator, specially as a "buy signal". Traders also use the inverse crossing (short-term going under the long-term) as a "sell signal", but I haven't looked much at this use yet -- and it seems to me less effective in that case, especially because I like more long-term trades.
Maybe one reason why the 20/50MA strategy worked so well for LINK but miserably for BTC might have to do with different timings of each asset, some may change faster, others more slowly. Also, I have to remark that the BTC chart above is ranging on a longer time frame, and indeed some of the entry points that look unsuccessful actually predicted a 10% gain after it, but since the chart shows a long time interval these small peaks look almost invisible.
Have you been using MAs to trade? What would you recommend?
Original post here.