
ZECUSD
With the cancellation of B2X - bitcoin went to the moon and then retraced with quite a steep drop, the volatility was insane. This gave rise to many other altcoins we've been tracking recently as they broke above our bullish price thresholds - XMR ETH LTC XRP ... W007.. I wonder if anybody chased!
I am looking at some of the other coins that haven't had quite as explosive a reaction - today lets check out Zcash
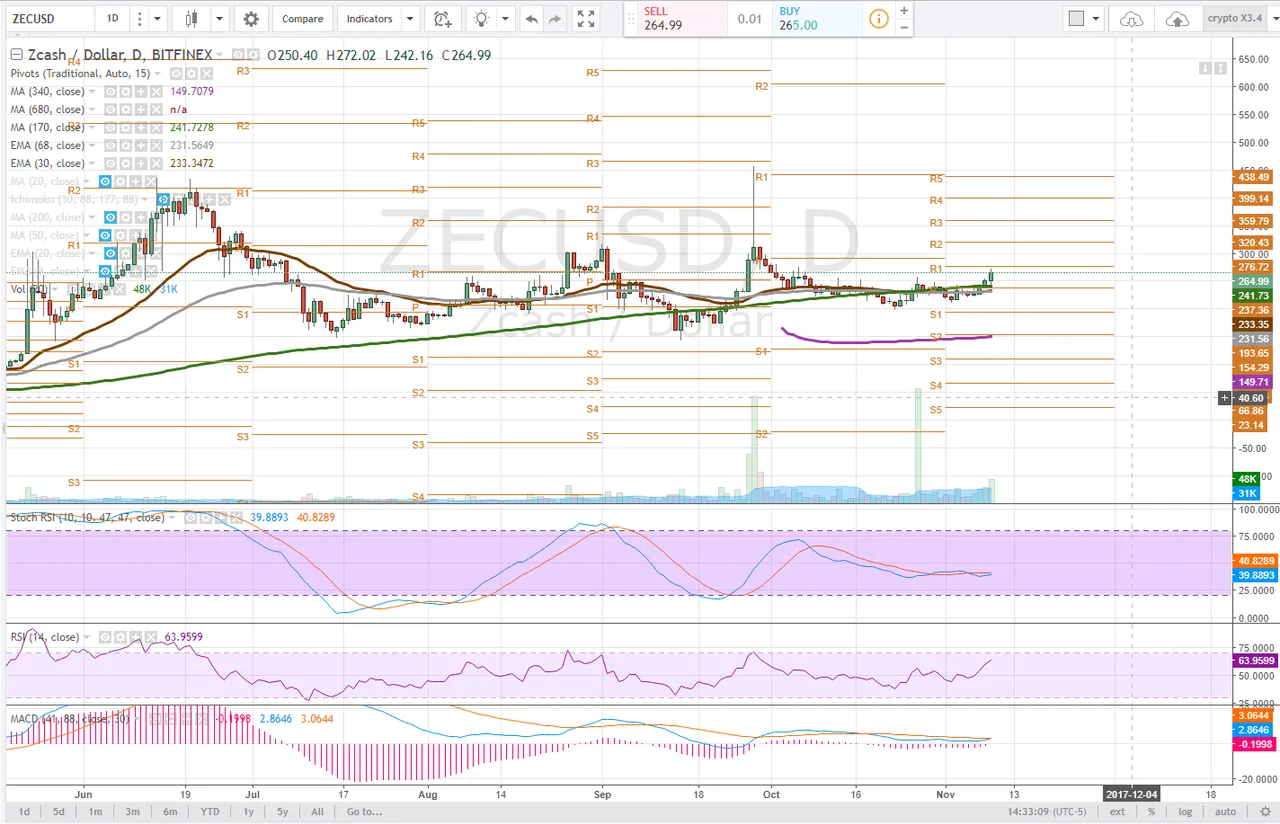
Daily
On the daily time frame we are observing a slight up tick in price with a test of pivot r1 which is driving an even tighter range on the moving averages. In a previous analysis if you recall we outlined a trendline that is guiding this series of higher lows and higher highs. A comment was that i could not do this with only 2 points, and this is simply not true especially when drawing trendlines on the daily time frame. Intraday there were about 5 points to connect for a trendline.
Monitoring the stochastic RSI we see it in the midground with the possibility of another bullish cross which would drive the price higher than R1. The MACD as well is showing us similar, with a possible bull cross seemingly imminent.
Not the RSI which was previously trending sideways has begun to move up.
Bulls need to take out daily pivot resistance r1 and hold the 68ema which if eyeballed aligns with our trendline.
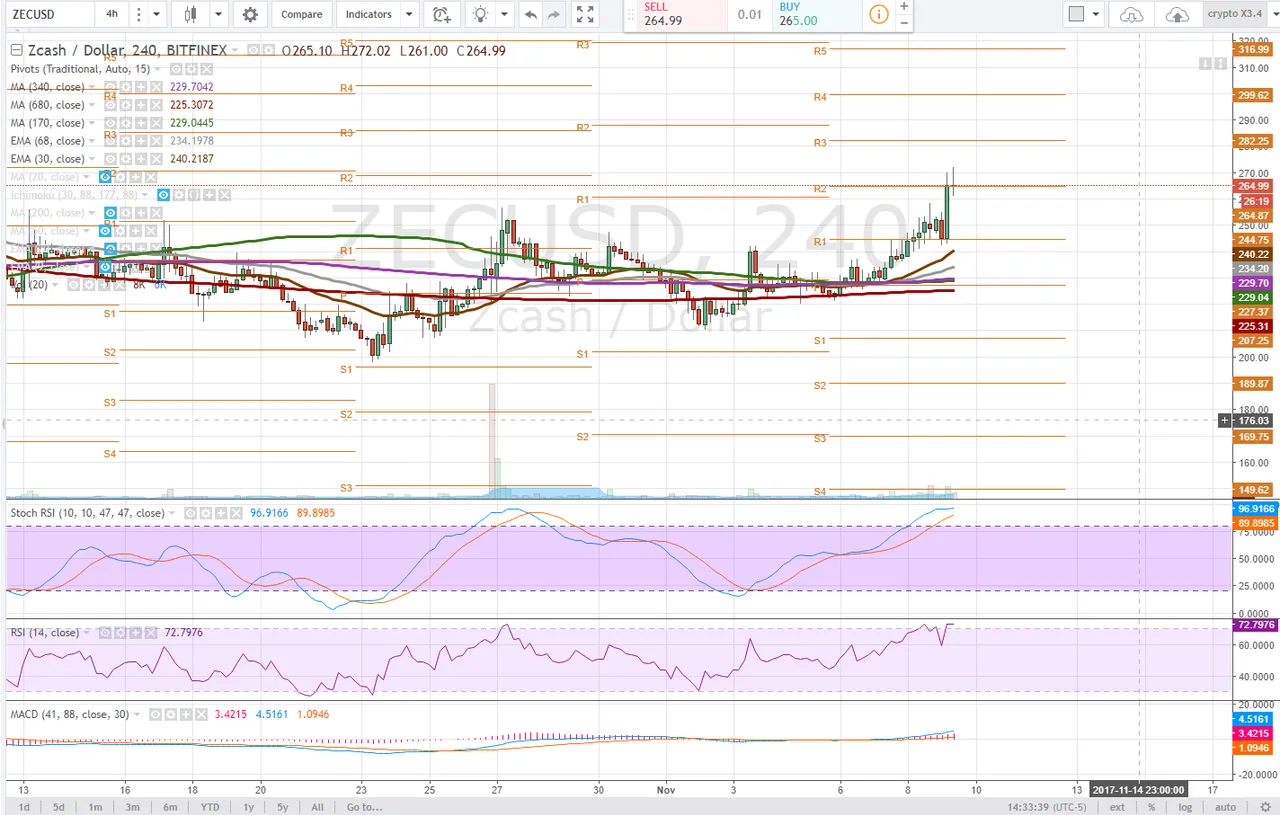
4 hour
On the 4 hour time frame we see a doji forming at pivot r2 and in my opinion showing us the need for some price consolidation here. Bulls would like to hold onto the previous high candle before this pop, approximately 258. A bull flag could then begin forming.
The RSI is overbought and the MACD and Stochastic RSI may have reached a point of inflection and over all the momentum indicators are signaling for more price consolidation. Bulls would like to hang on to the pivot support r1 on this time frame during consolidation approximately $244.
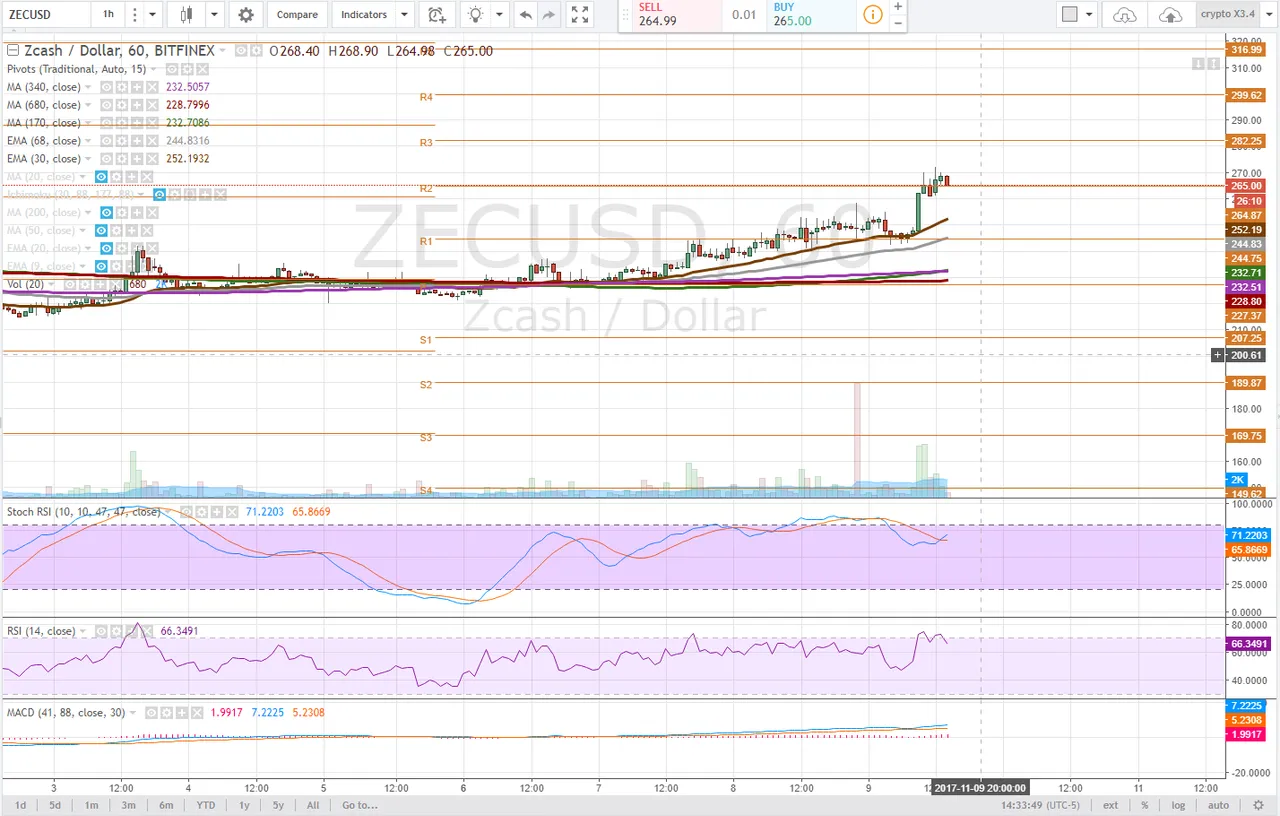
1 hour
On the 1 hour time frame we are observing that possible bull flag consolidation and notice the stochastic RSI is ready to push back into uptrend. A breakout is achieved above the previous high, $271.97. Bull flags can take quite some time to play out and the possibility of lower before higher remains.
The RSI has fallen slightly out of overbought and the divergence in the MACD is lackluster. I suspect consolidation for the next stochastic cycle.
Bullish Above: $272
Bearish Below: $250
RISK TRADE:Scale a long position up to the previous high, $258 sell below $250.
Don't forget to use stop losses!!!
Previous Articles:
XRPUSD
BCHUSD
ZECUSD
LTCUSD
BTCUSD
ETHUSD
BTCUSD
LTCUSD
XMRUSD
Follow at your own risk, Not a financial adviser, understand the risks associated with trading and investing. Manage your own Risk - in other words you could lose it all and it's your own fault.