
XRPUSD - Day Traders Setup
Last time we looked at XRP we were expecting a bullish move above the $0.23 cent range from $0.20. The price has grinded higher prior to an announcement by American Express that they will be adopting the Ripple Blockchain for processing transactions. The price spiked on this announcement and retraced back to the $0.23 range. This on appearance may not be positive to most, but what it indicates is that the floor moved up from 20 cents.
Ripple is generally unloved by the crypto community, considered the anti-thesis of decentralized currency, but if we are all here to make money and 65 multi-billion dollar banks back this coin, you should probably own some.
Moving averages:
Green = 50dma
Red = 200dma
Orange = 9ema
Black = 20ema

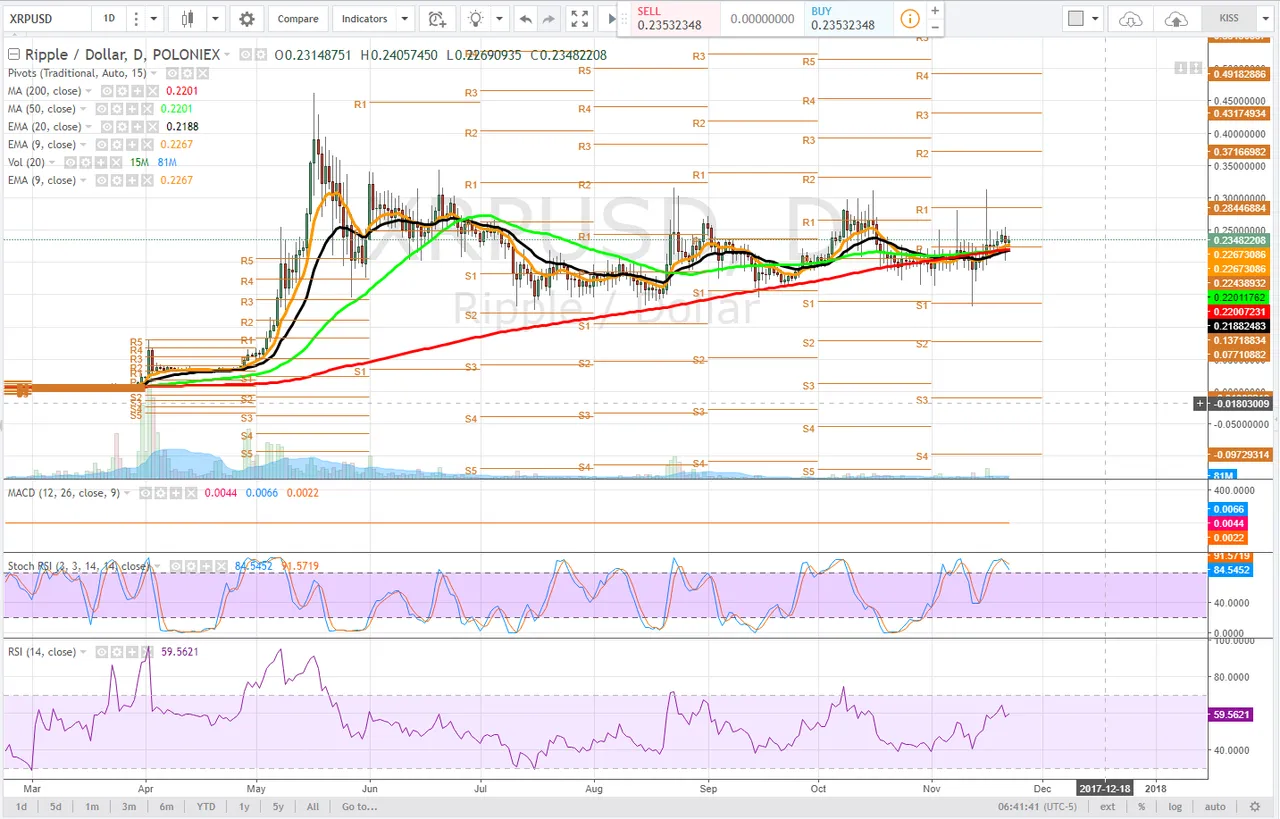
Daily
on the daily time frame we were observing a convergence of moving averages, with the 50dma and 200dma close to a bearish cross, however, momentum and the curl in each average indicated to us the bearish cross was unlikely. It has yet to occur. What we are observing is the 9 and 20ema have begin to push past the 50dma and 200dma, this is very bullish and each ema offers additional support.
The stochastic RSI has been in uptrend and curled back to the 80 line, bringing the price down to retest the 0.2345 range. This is a critical range to hold, formerly resistance it is now support, bulls would like to keep it that way.
The RSI has not reached overbought conditions and is continuing to trend upwards, suggesting the bulls are in control for now.
The MACD itself is flat, hanging around the zero line. In a broader view, XRPUSD is forming a giant bull flag. Our next area of resistance is the previous high $0.312 which was a double top.
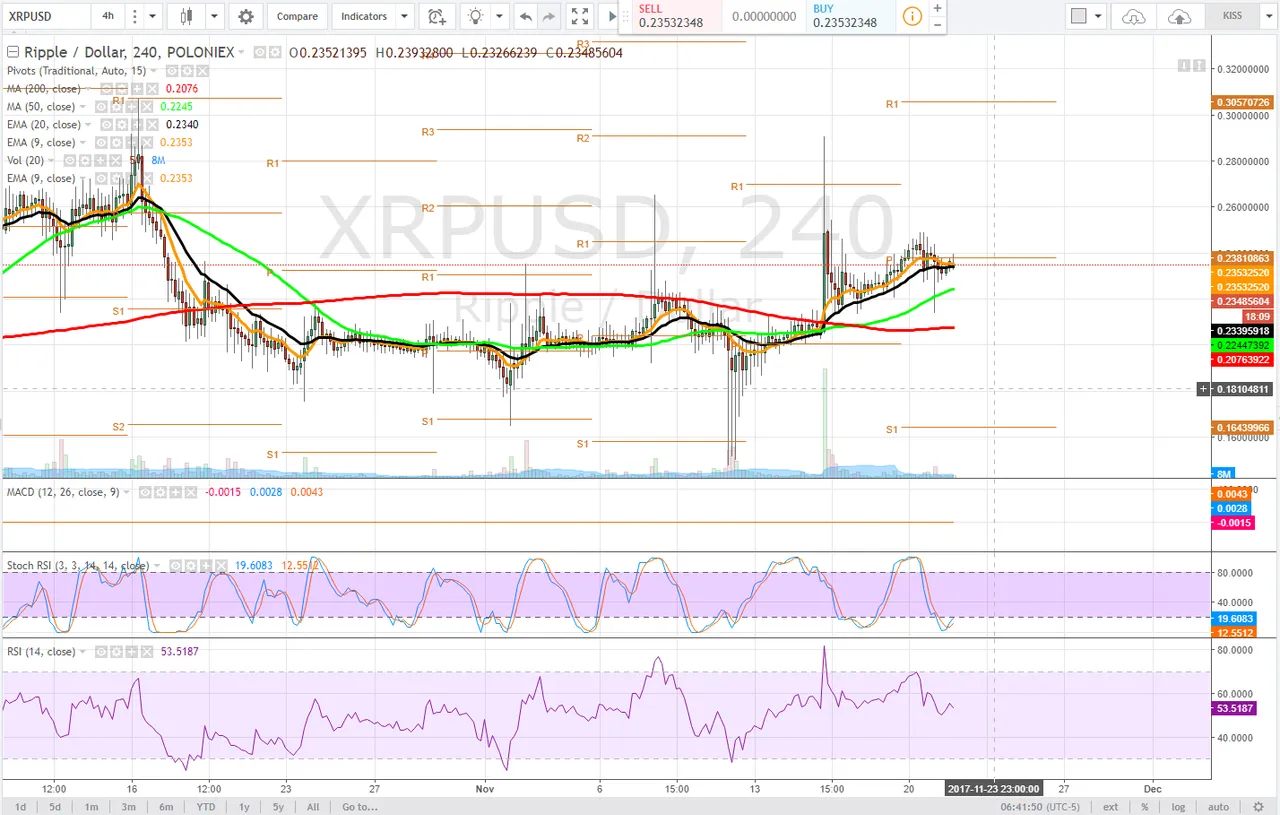
4 hour
On the 4 hour time frame we are finding resistance at the pivot, $0.238 - an area bulls need to turn into support. It appears the 9ema is going to cross below the 20ema, if price loses this range and a bearish cross occurs, our next support is the 50dma (green) $0.2244
Conversely we see clearly a golden cross occurred, the 50dma pushed above the 200dma. Moving averages are backward-looking indicators but still this is an extremely bullish formation. The stochastic RSI is in the downtrend range but has produced a bullish cross as the RSI trends sideways. If volume comes in the stochastic RSI should push higher, saving bulls from the 9ema and 20ema cross.
It's very much possible that a cup and handle is forming on this time frame and so the range to the upside where we might expect a pullback is the $0.30 range.
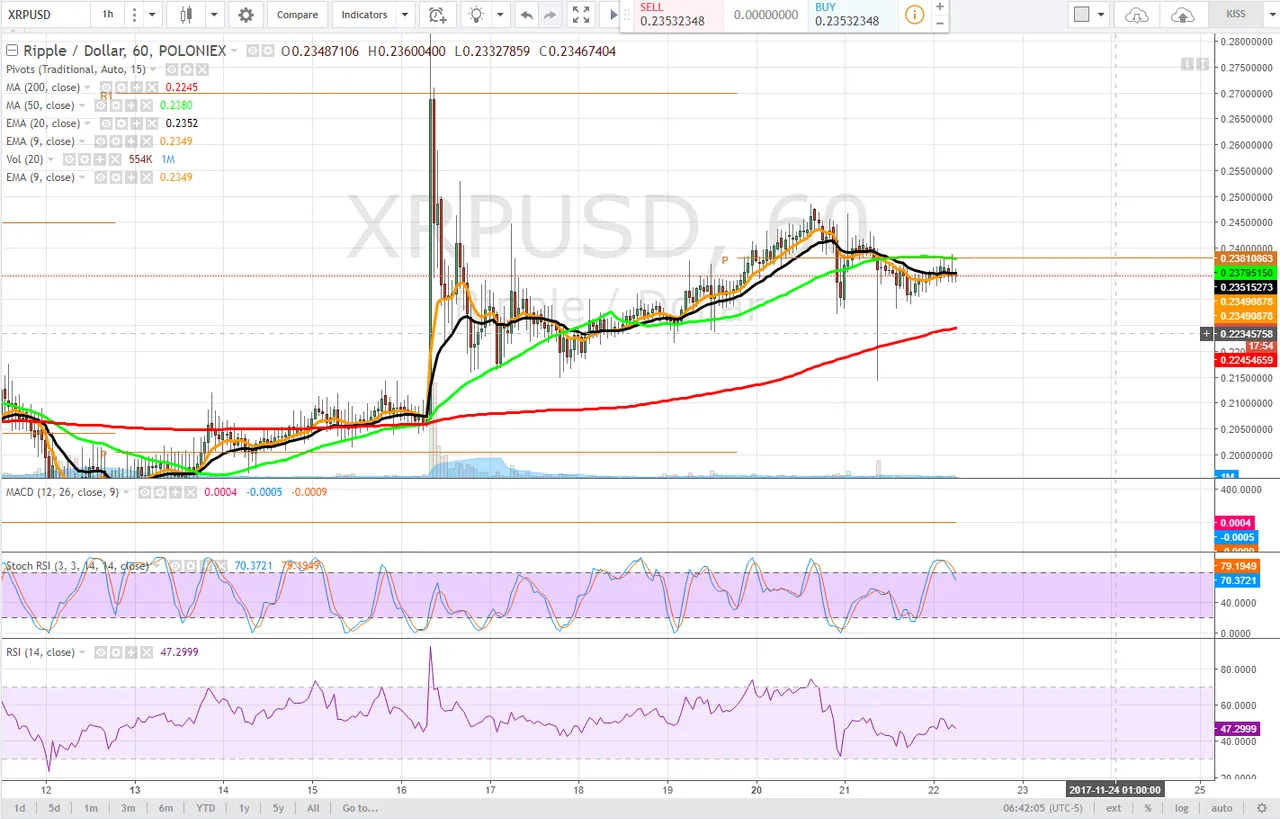
1 hour
The 1 hour time frame has its 50dma converged with the pivot resistance and so this is our first goal to reclaim as support for price progression. If the price can move back above this level, bulls can take full control of the price.
While the stochastic RSI has begun to curl downwards, the price is finding support at the 9 and 20ema and a bullish cross of these moving averages appears likely (9ema above 20ema is bullish). If the price fails to hold this level, we will retest the 200dma, $0.2245.
Bullish Above: $0.24
Bearish Below: $0.21
RISK TRADE: Scale a long position all the way to the 1 hour 200dma, set stop just below. Conversley wait for confirmation, and the price to reclaim the 50dma on the 1 hour chart as support and enter a full scale position.
Don't forget to use stop losses!!!
Previous Articles:
NEOUSD
DASHUSD
BTC Vs. BCH
BTCUSD
ETHUSD
BTCUSD
BCHUSD
BTCUSD
ZECUSD
XRPUSD
Follow at your own risk, Not a financial adviser, understand the risks associated with trading and investing. Manage your own Risk - in other words you could lose it all and it's your own fault.