
LTCUSD
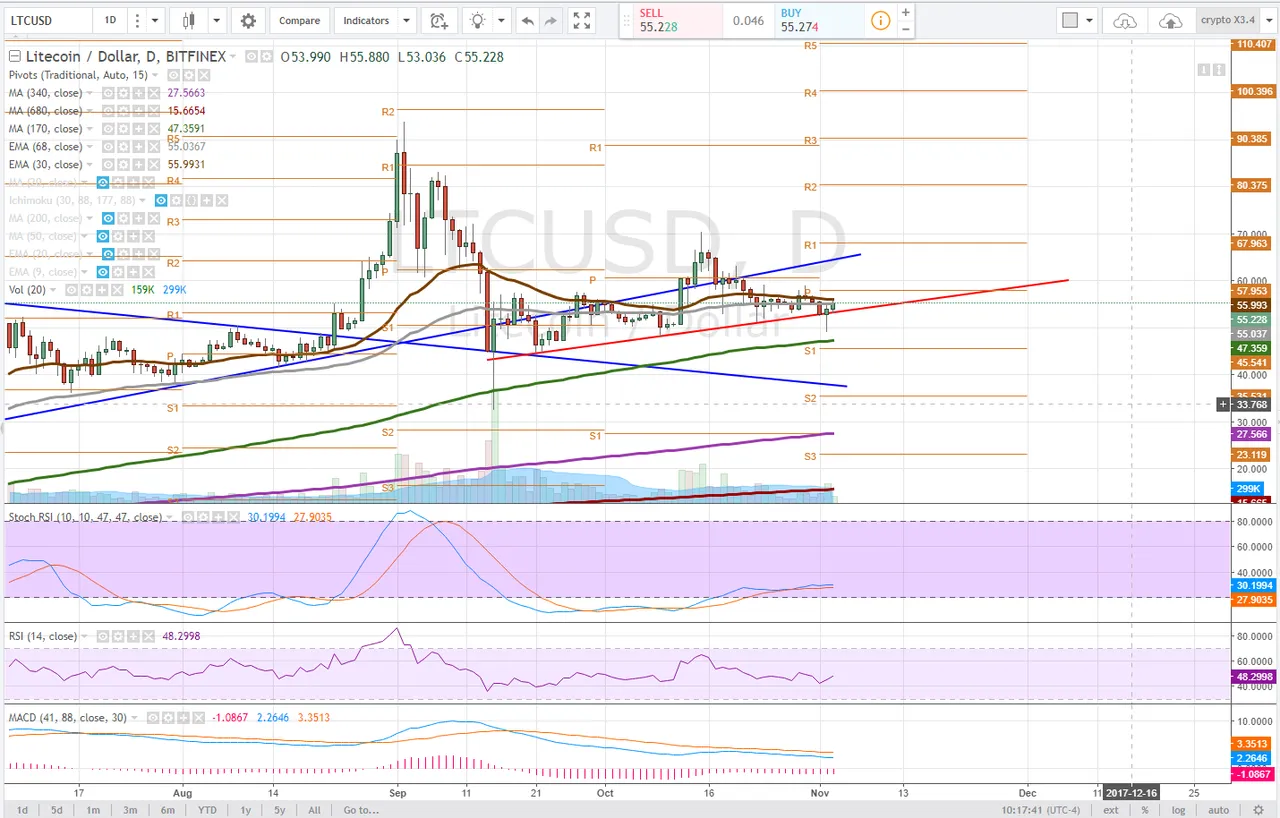
Daily
On the Daily time frame we have been tracking and trading the sideways action of LTC following a trendline and using moving averages as areas of support and resistance (buy and sell ranges)
Currently, the price dipped below the red trendline before reclaiming and now resting just above the price of LTCUSD is trying to reclaim the 30ema as support. Doing so would prevent a bearish cross and give way to a test of the daily pivot, $57.95.
The stochastic RSI has managed to perk out of a downtrend, though the rate of ascent is muted and therefore indicates that there isn't much bullish momentum. The RSI itself is relatively trendless. This is a sideways trades, scalp accordingly - we are waiting for a move in either direction as the MACD continues to trend towards the zero line.
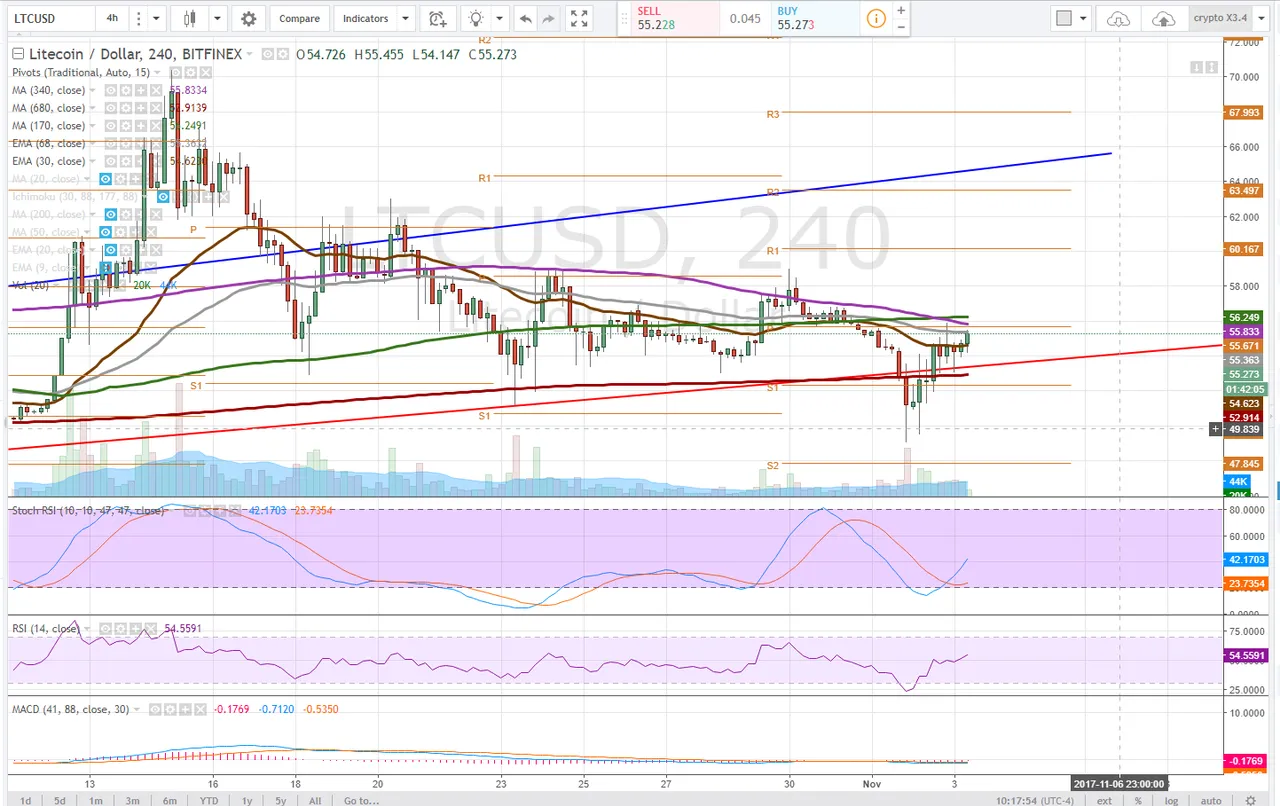
4 hour
On the 4 hour time frame we are observing more prominent bullish momentum in the stochastic RSI as the price tested an bounced back above the 680 DMA and is currently in a tight range between the 30ema (brown) and the 68ema (grey) Bulls would like to see the price retake these moving averages as support with the pivot near by consolidation should be expected under the 170dma, our goal for some bullish price action on this time frame. If price can reclaim 170dma bulls will look to target pivot R1 ($60.16).
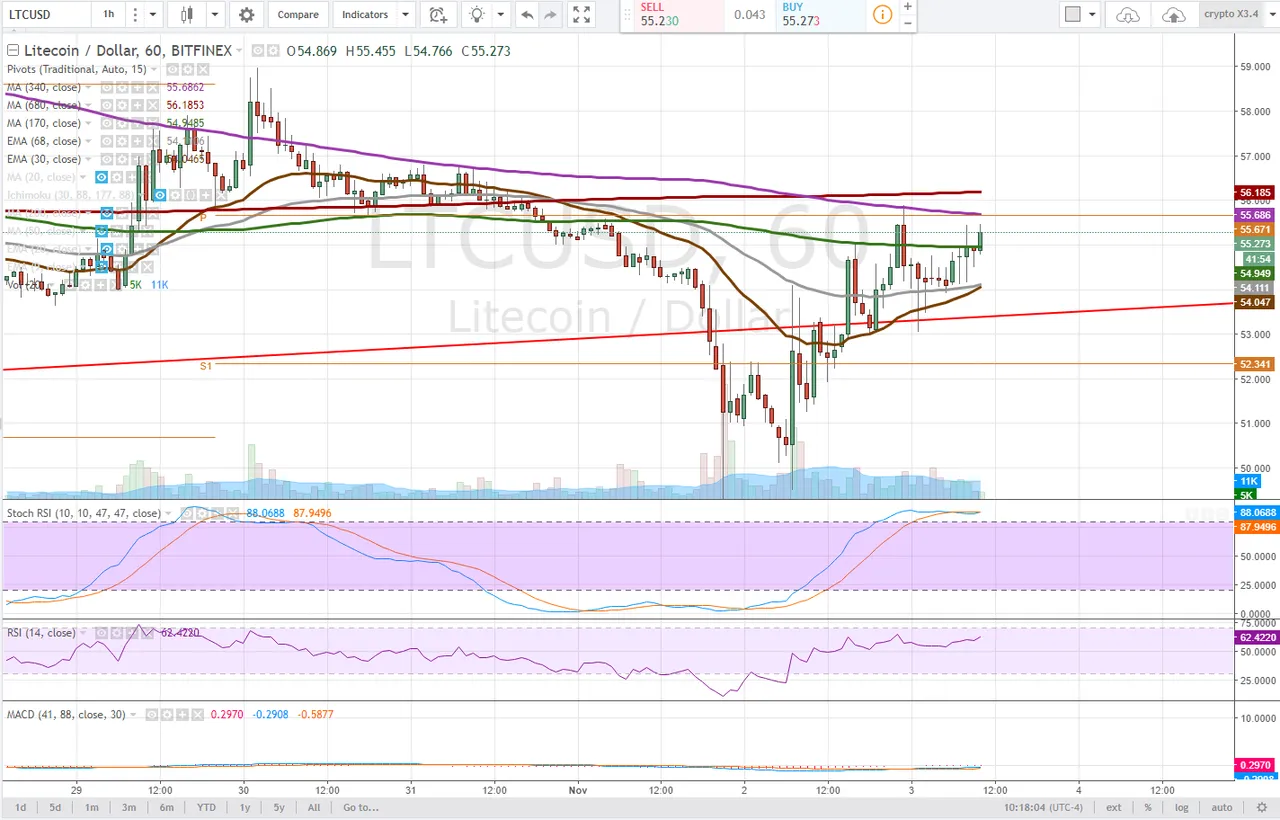
1 hour
The stochastic RSI on the 1 hour time frame is extended and the bullish price action is potentially driving a bullish cross of the 30ema over 68 ema. Shorter term this very bullish for a trendshift. The price is currently stuck between the 170dma and the 1 hour pivot approximately $55.67. Bulls need to see the pivot become support on any test and a rejection would not be conducive to price progression. While the RSI did reach oversold, and the price bounced this is why bulls should be cautious as this may well be a dead cat bounce and a retest of the red trendline must hold to start staircasing the price upwards. The first real sign of a trendshift will occur when a series of higher lows and higher highs begins to form.
Bullish Above: $56.20
Bearish Below: $54
RISK TRADE: Wait for a break of 56, price above the 4 hour 170dma, looking for a test of the daily pivot, and if it breaks to the upsid bulls look to R1 pivot on the 4 hour chart, $60. Use stop losses as if the price loses pivot support after a break up it could indicate lower.
Don't forget to use stop losses!!!
Previous Articles:
BTCUSD
BCHUSD
ZECUSD
LTCUSD
BTCUSD
ETHUSD
BTCUSD
LTCUSD
XMRUSD
Follow at your own risk, Not a financial adviser, understand the risks associated with trading and investing. Manage your own Risk - in other words you could lose it all and it's your own fault.