BTC and Dominance Chart Published By Philosof at TradingView
https://www.tradingview.com/u/Philosof/


Bitcoin chart review
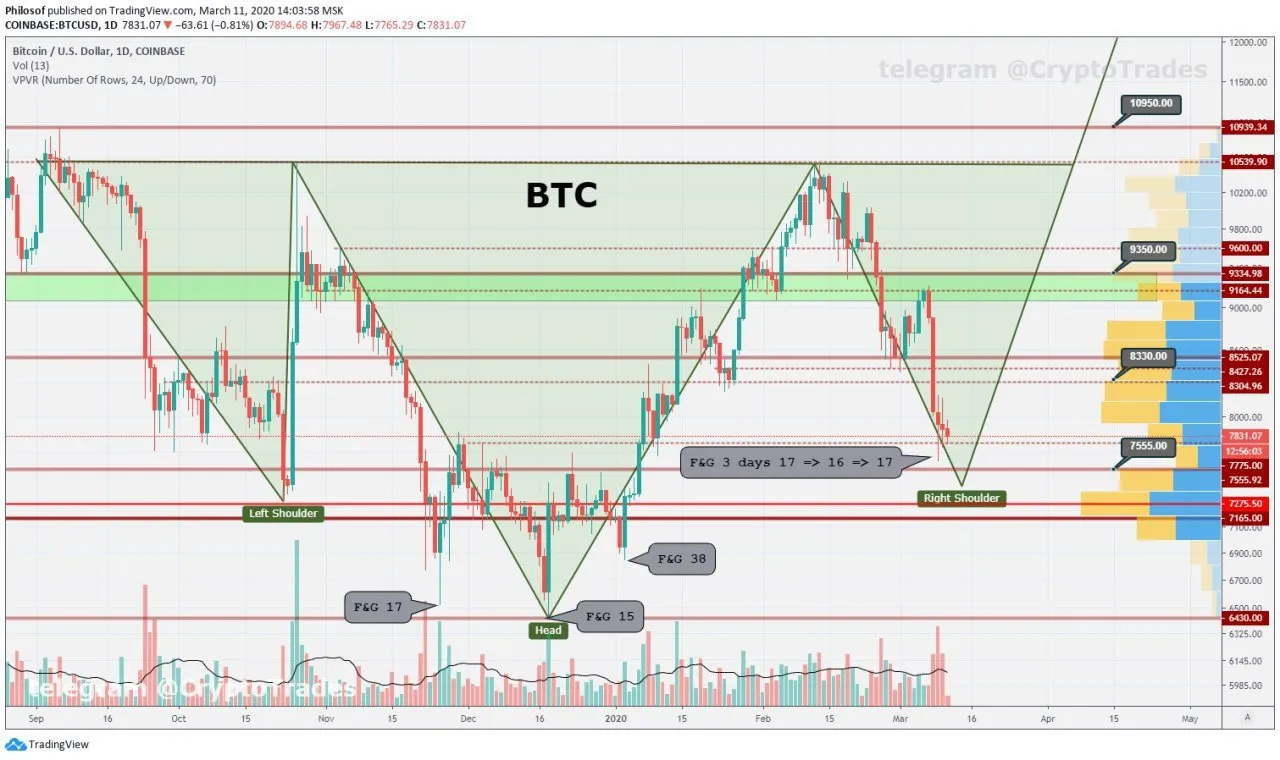
Comment: Lets return back to inverted head and shoulders chart and lay F&G index on it. On December 18th (LL at 6420) index was 15 and now 17. That is pretty close to reversal. Sure index always can drop lower, or lowest value can be above future lower low price. Nevertheless bottom for that retracement is near. P.S. That forecast will become invalidated in case price drops below ~7300.
Feb 27th post: BTC dumped to 8500, which potentially can extend down to 8300 - 7550 to form right shoulder of inverted H&S bullish pattern.
Resistance: 8000 - 8300 - 8500 - 8700
Support: 7170 - 7400 - 7555 - 7800
Fear & Greed index: 17 (<= 16 <= 17 <= 33 <= 38 <= 39)
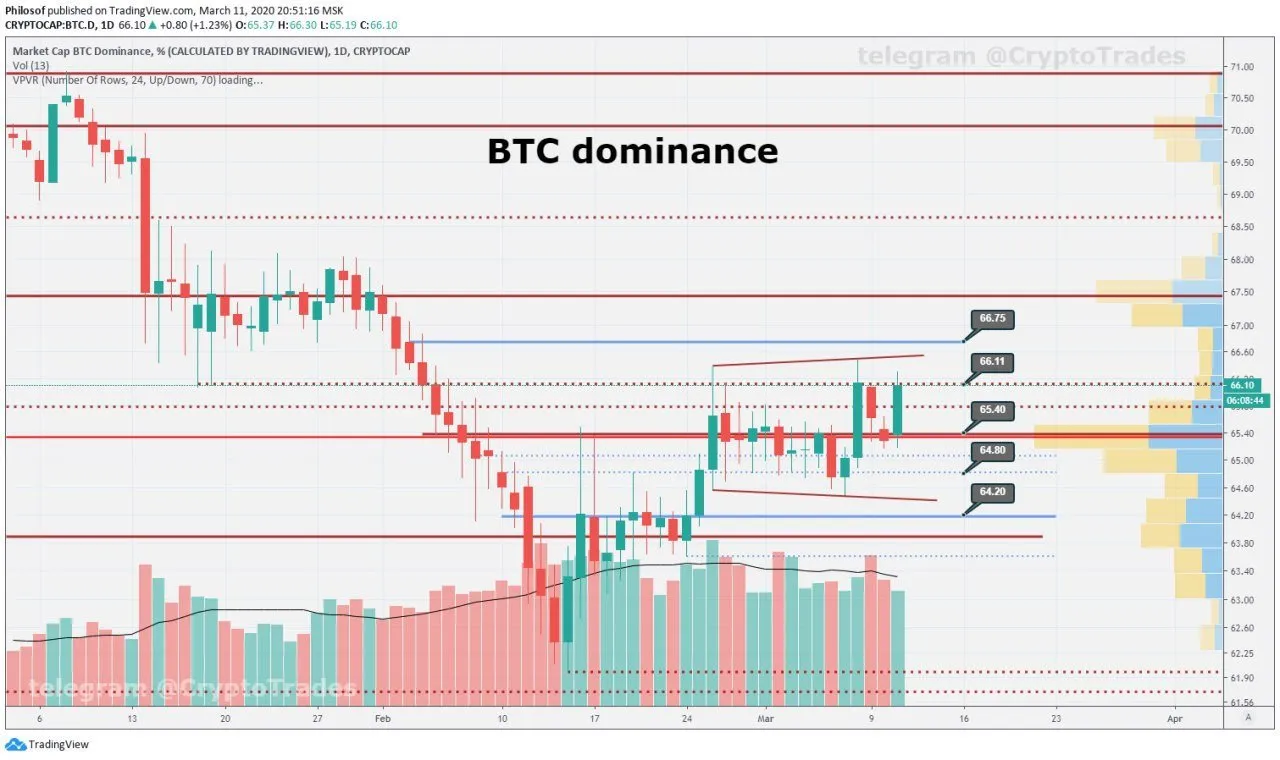
BTC Dominance: 64.3% (<= 64.1 <= 63.4 <= 63.5 <= 63.2)
⚙️ 24h Volume: $135 billion (<= 149 <= 177 <= 134 <= 130)


As BTC fail to hold for 7800 support, Dominance raising up. Next stop for BTC around 7555 and for dominance at ~66.7 (TradingView chart).

Quote
"There is no stress in the world, only people thinking stressful thoughts and then acting on them." Wayne Dyer
If You Like This Post Upvote,Resteem and Follow Me
