Bitcoin Charts Published By Philosof
https://www.tradingview.com/u/Philosof/
Bitcoin CME Futures Day Chart Review

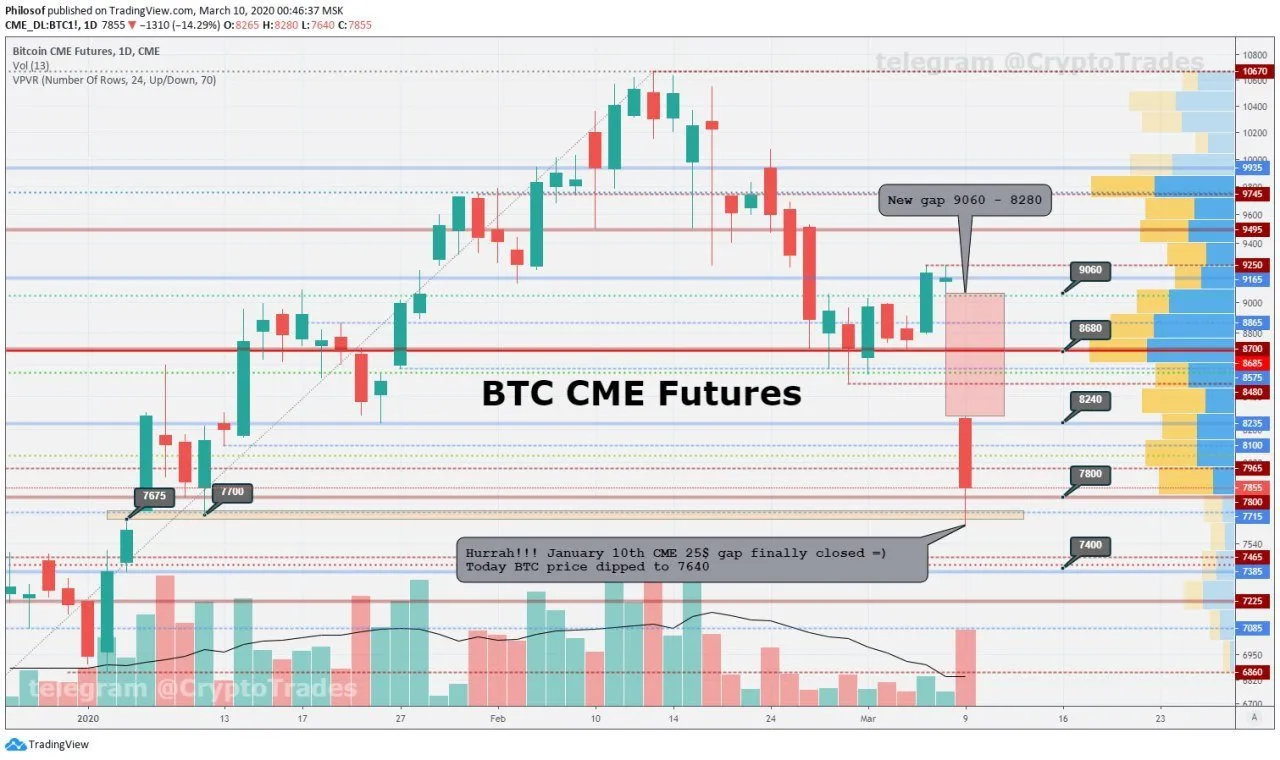
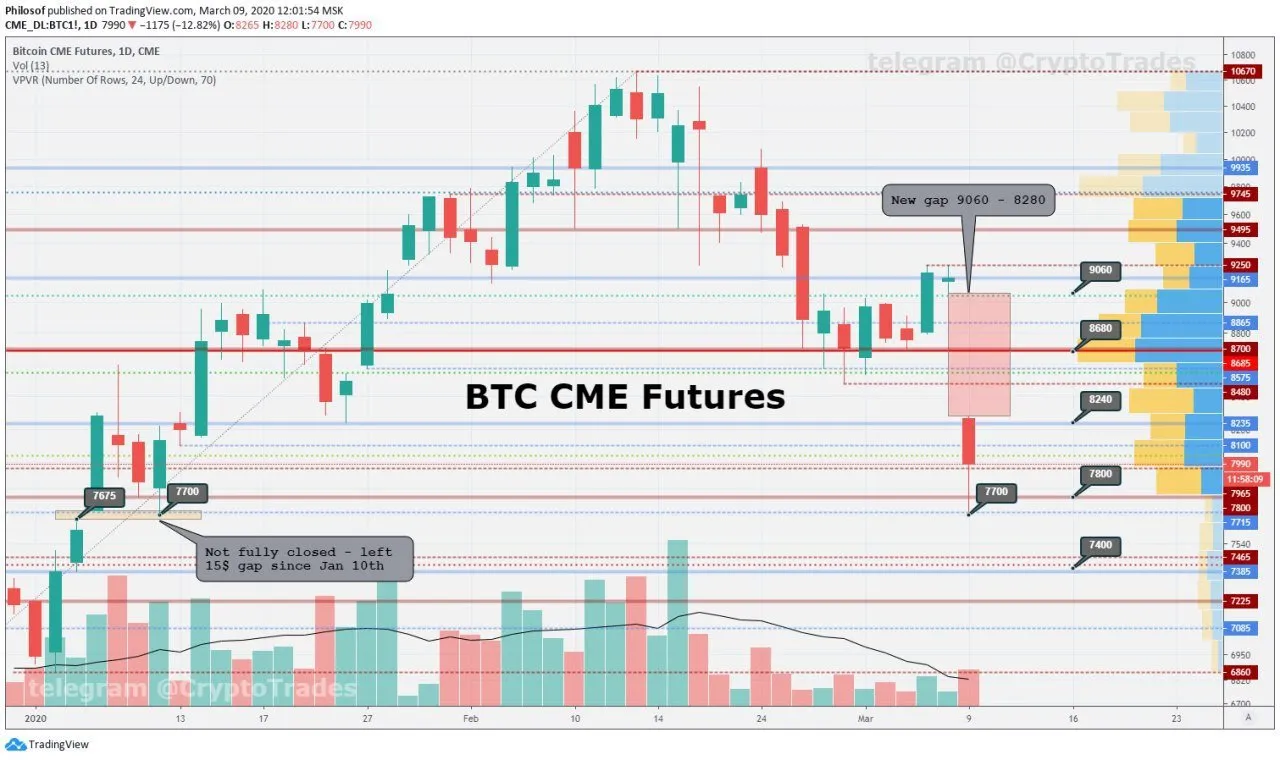
Good news for Gap lovers, Till today CME Futures day chart had only two gaps that were not closed. One was left on 9-12 August at 11695-11795 range. And another tiny 25$ gap left after January 6th at 7675-7700. Last one was closed by today's dump.
Now we have two gaps above just a matter of time...

Bitcoin chart review

CME Futures Day Chart

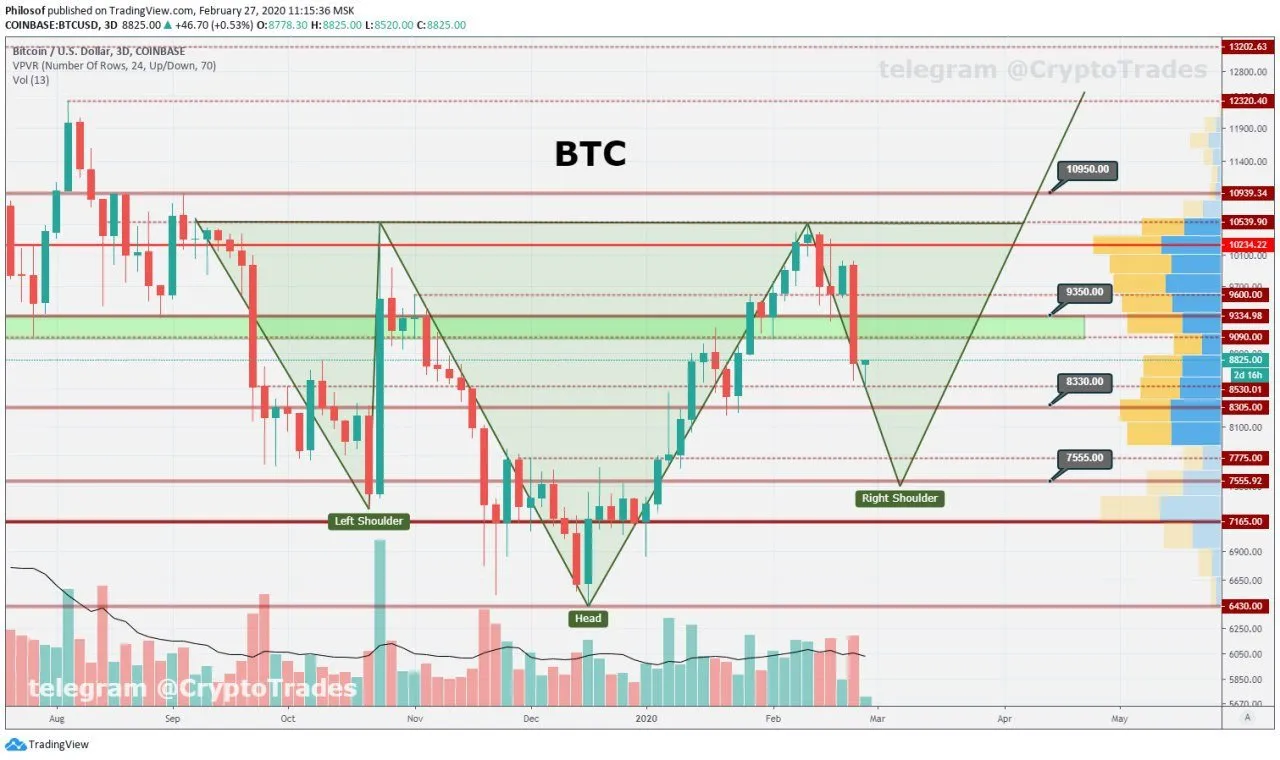
Comment: Forecast made 11 days ago almost fully realized. Now we have a beautiful inverted H&S. Obviously right shoulder within same pattern can drop lower to ~7300-7400. But lets hope it won't dip below this year open price at 7155. CME futures day chart has a huge gap from 8280 to 9060. Traditionally these gaps always close. "Hope" is not the best word in trading, but I really hope for traditions to keep on working.
Feb 27th post: As expected, BTC dumped to 8500, which potentially can extend down to 8300 - 7550 to form right shoulder of inverted H&S bullish pattern.
Resistance: 8240 - 8500 - 8700 - 9060
Support: 7300 - 7800 - 8000 ✅
Fear & Greed index: 17 (<= 33 <= 38 <= 39 <= 41 <= 40)
BTC Dominance: 63.4% (<= 63.5 <= 63.2 <= 63.6 <= 63.8)
⚙️ 24h Volume: $177 billion (<= 134 <= 130 <= 143 <= 134 <= 167)

If You Like This Post Upvote,Resteem and Follow Me
