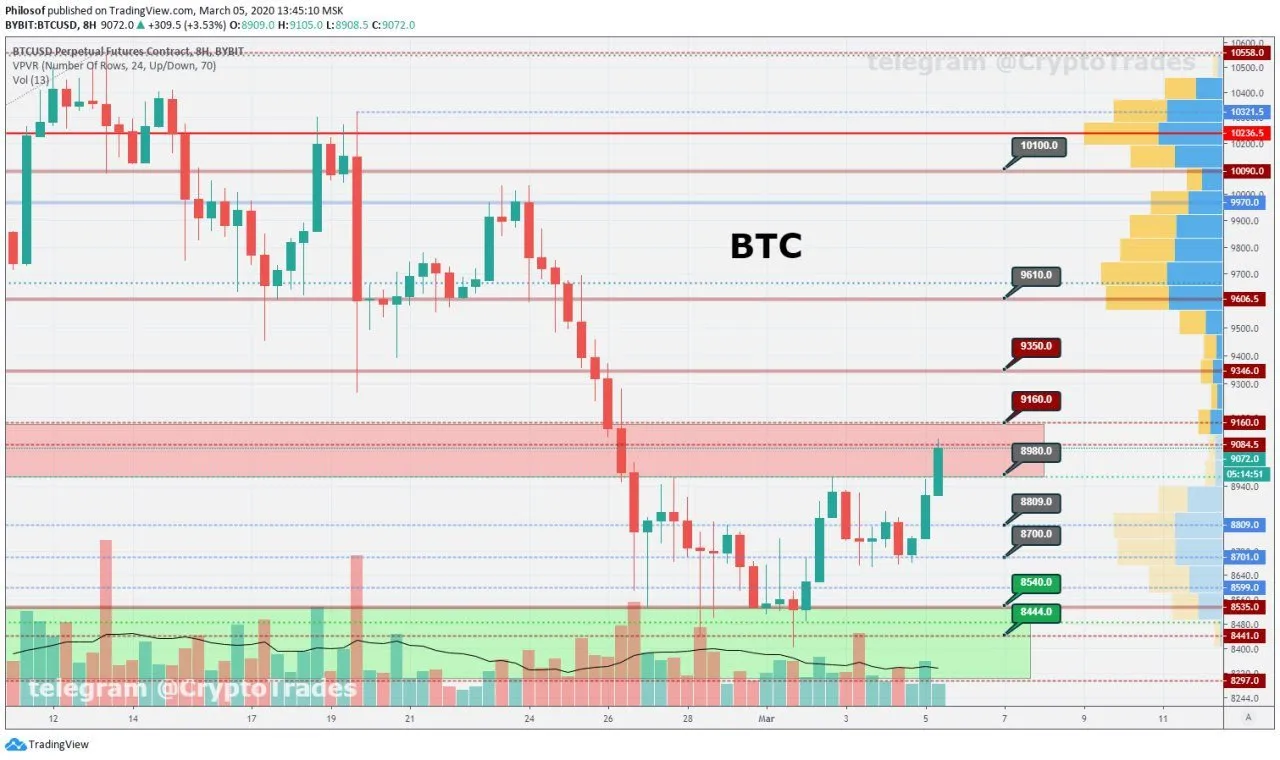
Bitcoin Chart Published By Philosof
https://www.tradingview.com/u/Philosof/
Bitcoin chart review

Comment: Bitcoin finally broke out 8900-9000 resistance. Not much volume in this move, but RSI also broken its own trendline. That move was expected and forecasted several days before. The only question is how far price will grow and what will be market reaction to it. Strong resistance area is up till 9350. "Red spot" at 9272 left after February 19th dump. So far targeting these zones - if grow above will get to ~9800. If rejected, fall lower to 7550. second scenario has more chances, but that doesn't deny possibility for bullish outcome. In any case alts seem to be growing together with the King, so everyone wins and happy
Resistance: 9090 ✅ 9160 - 9300
Support: 8540 - 8800 - 8900
Fear & Greed index: 41 (<= 40 <= 38 <= 38 <= 39 <= 38)
BTC Dominance: 63.8% (<= 63.6 <= 63.6 <= 63.9 <= 63.8)
24h Volume: $134 billion (<= 167 <= 176 <= 130.5 <= 132)

If You Like This Post Upvote,Resteem and Follow Me
