BTC Chart Published By Philosof at TradingView
https://www.tradingview.com/u/Philosof
Bitcoin and Dominance Chart Review
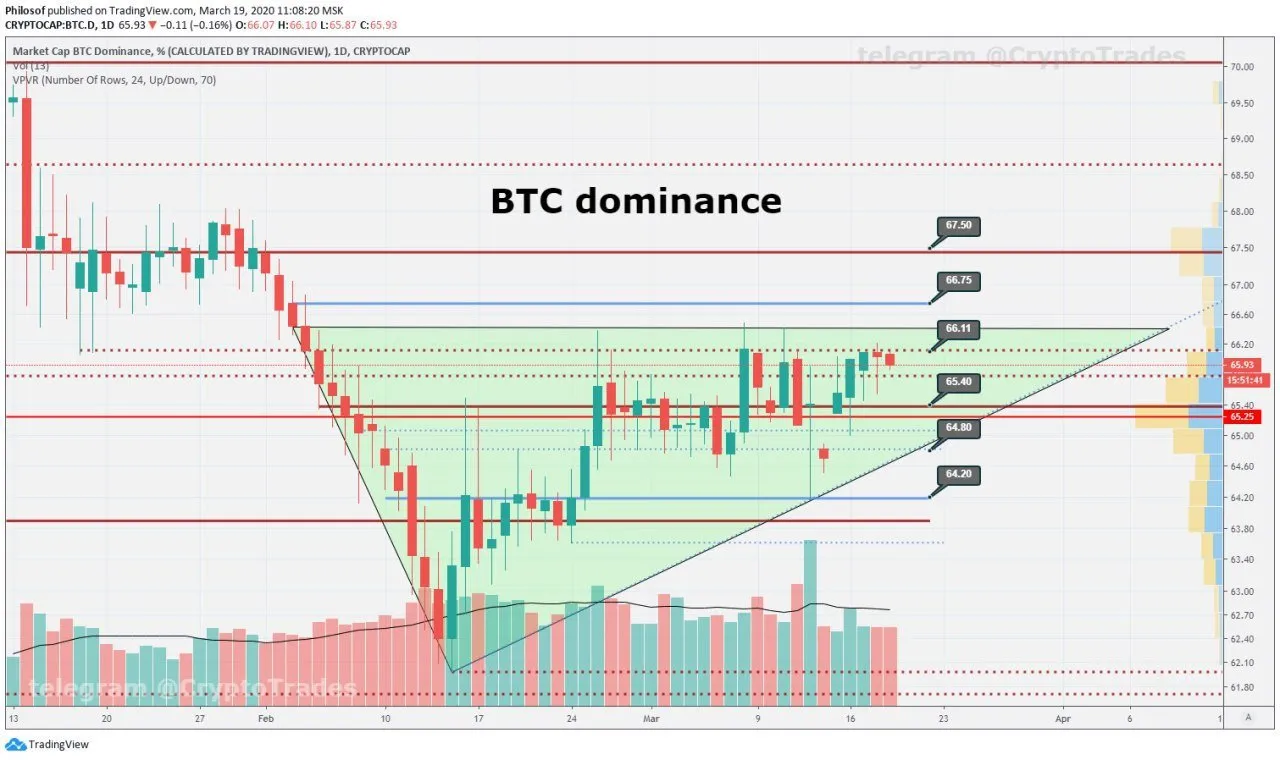
Bitcoin Dominance chart

Well, dominance didn't pump. Instead it failed to grow above ~66.11 resistance zone and today pulling back, which results in alts growing and some even pumping. Dominance could be falling to 65.2-65.4 zone which will be lower border of that triangle. Than either bounce or dump.

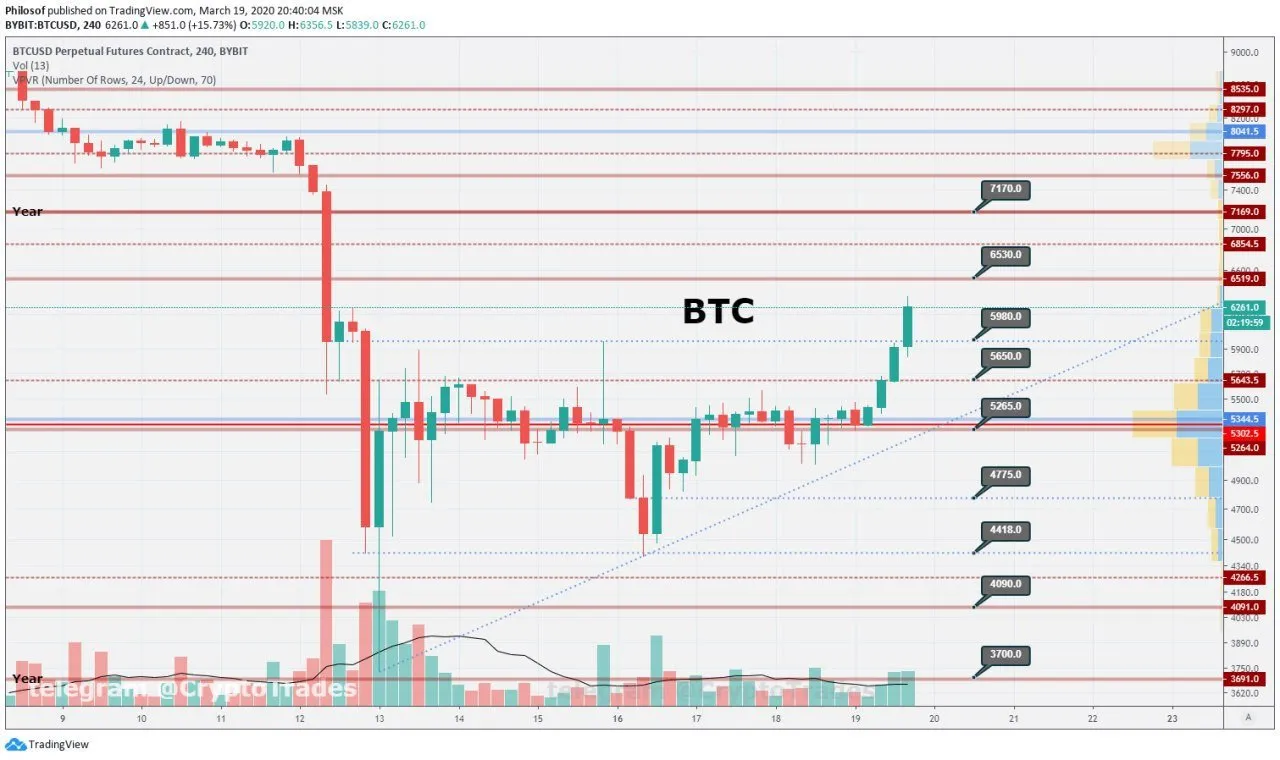
BTC CHART

COMMENT:- Last hour brought some bullish volume to BTC chart. Could be growing to 6200-6500 resistance from here.
Target at 6200 resistance done ✅ Look bullish, but I'd recommend to be careful here, as BTC is approaching higher high for today. Resistance at 6500 still untouched and asking for a kiss, but same level can be considered for potential shorts.
ALTCOINS Update
Pretty much ALL ALTCOINs dumped at the same time. The same ALTCOINs bounced at the same time 40%, 50% some even more. Just wait until the dump more since Whales must lock in Profits.
Altcoins moving up. Market show bullish signs, while BTC climbing towards 6.5k resistance.
You really don't need to scan the market because you will see the exact same thing on all coins. FOCUS on the top ones: BTC, ETH, LTC... you don't need more to make some money.
BTC Resistance: 5650 - 5960 - 6500
BTC Support: 4775 - 4550 - 4100 - 3700
Fear & Greed index: 12 (<= 11 <= 8 <= 9 <= 12 <= 8 )
BTC Dominance: 64.3% (<= 62.9 <= 63.6 <= 64.1 <= 63.7)
24h Volume: $124 billion (<= 114 <= 150 <= 122 <= 109)

Check This Previous Post:
https://steemit.com/bitcoin/@khalil319/tradingview-bitcoin-chart-review-and-update-2

If You Like This Post Upvote,Resteem and Follow Me
