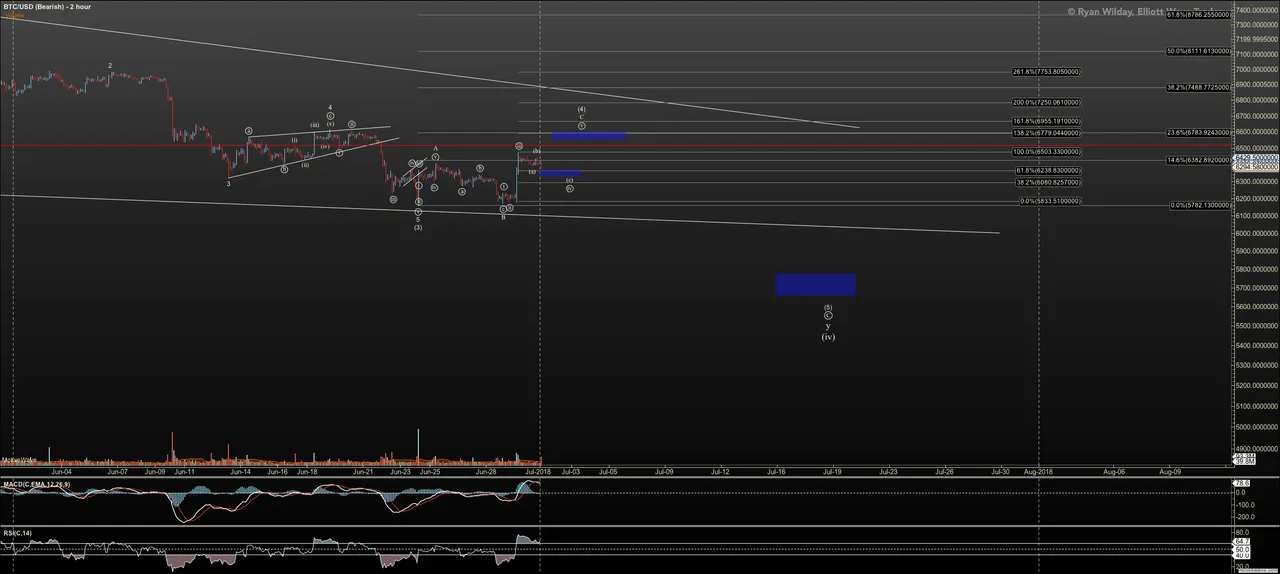
Repost of an article I ran this week on Seeking Alpha and I have added a 'prologue' for recent price action.
In last week’s ‘Weekly Opportunities In Cryptocurrency: Challenging The Bearish Case?’, I noted that Bitcoin and Ethereum prices was pushing up against resistance in a tight range. And, if price had pushed through, it would have challenged the decline in price I was watching. Yet, the evening after that article posted, price fell away from resistance with Bitcoin hitting a low around $5985, depending on exchange, and Ethereum $419.
Therefore, I have little to report, other than that I’m sticking with my primary count that considers $4700 the ideal bottom for Bitcoin, with potential extension to $3000.
From where we are sitting at time of writing, I note the potential that we can climb into a resistance zone which runs as high as $7045 Bitcoin, and $485 for Ethereum. Below both these levels, and my primary view remains.
I currently believe we'll put in a high C wave rally in both coins to achieve a hit at the resistance but below $6900 in Bitcoin and $419 in Ethereum.
I have seen one challenge to my primary view in Ethereum. I just don’t see the extensions in Ethereum for a run down to the $200s with the possibility of seeing $133. With each decline in Bitcoin, we’ve seen a smaller percentile in decline even though Ethereum has classically been a higher beta coin.
Because I’m observing Ethereum in this more tenuous decline, I have added the red count which halts in the $300s. This is using an ‘ending diagonal’ pattern instead of a standard impulsive pattern for the C wave.
Application
For short term traders, a C wave into the resistance zone above can be a good short if entered closer to resistance, $7045 BTC and $485 ETH. A strong move through those levels would be a good stop in my view.
Long term traders would want to wait until we see those lower levels to add to their portfolio. Particularly, if we hit the lower levels with the positive divergence we have on charts into the 4 hour timeframes, these levels provide a nice long term entry.
If instead we move over the resistance levels marked out, I will be looking up and discussing potential paths for a rally.
Prologue
We did in fact rally in a C wave higher, from when I wrote this for Seeking Alpha. As of this morning we should be in the circle-iv of that C wave, which if we are to get the 5th higher, should not violate $6160 by much. A nominal target for the fth higher should be as high as $6800 before we start our next leg toward $4700. If instead we continue to rally higher and break over $7050, something more bullish than my primary thesis may be in play. I have already worked up a point of view with a couple options should that happen. In my own trading, I am long but plan to use my short term account to go short for the ride down to hedge my long term portfolio.
We saw the short interest really climb high, approaching new records seen in April before coming down hard, some of this rally was simply short covering induced.
For easy viewing, open image in new tab.
