So far, 2018 has been a tough year for Bitcoin and altcoin holders alike. Since the December high was recorded above $19,000, Bitcoin has fallen by a whopping 64% peak to trough.
For the HODLers[1], this is nothing new, unexpected, or even surprising. Those that have been trading Crypto since inception, have experienced up to seven such periods or bear markets cycles in its short history. Cryptocurrency trading is not for the faint of heart!
Chart 1.
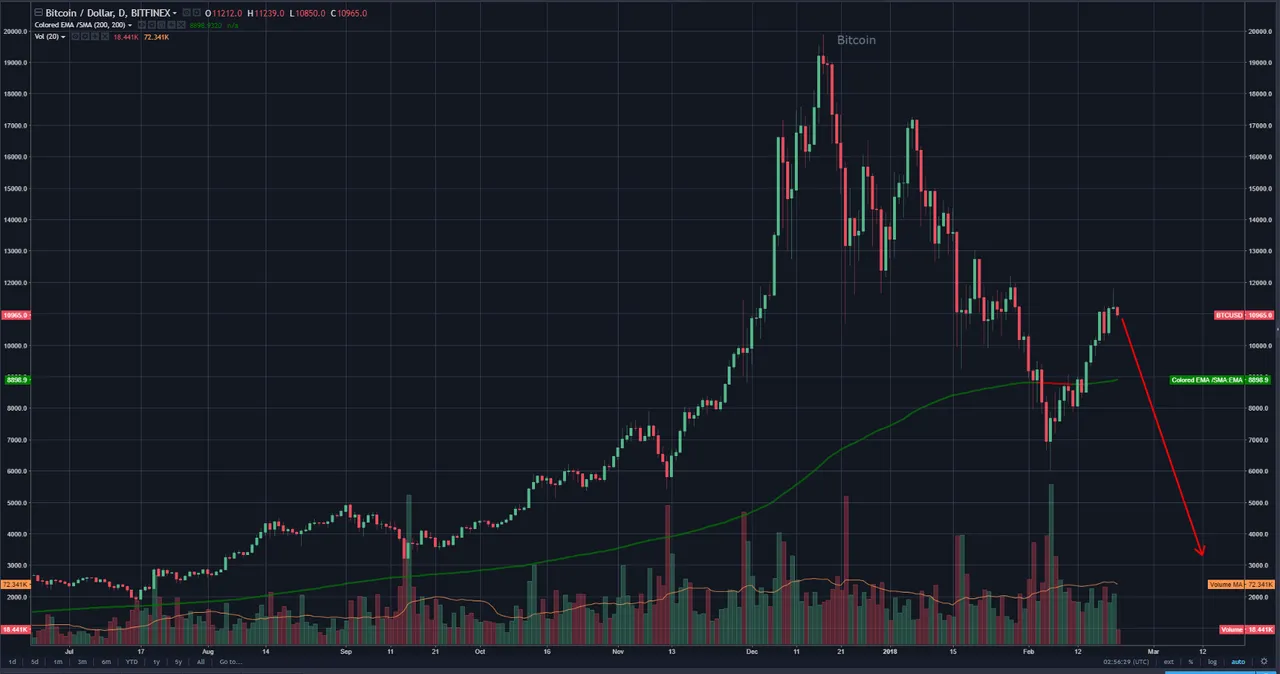
However, for the newest entrants into the cryptocurrency ecosystem, it will have been an exciting and likely scary experience, depending on their level of exposure and entry point. Those that dipped their toes into Bitcoin prior to, and in the week following, US Thanksgiving 2017, remain in the money or at break even. Anybody who invested later in year and didn't take profits, are looking at significant paper losses after an approx. $12K drop in the market price.
What happened?
Chart 2.
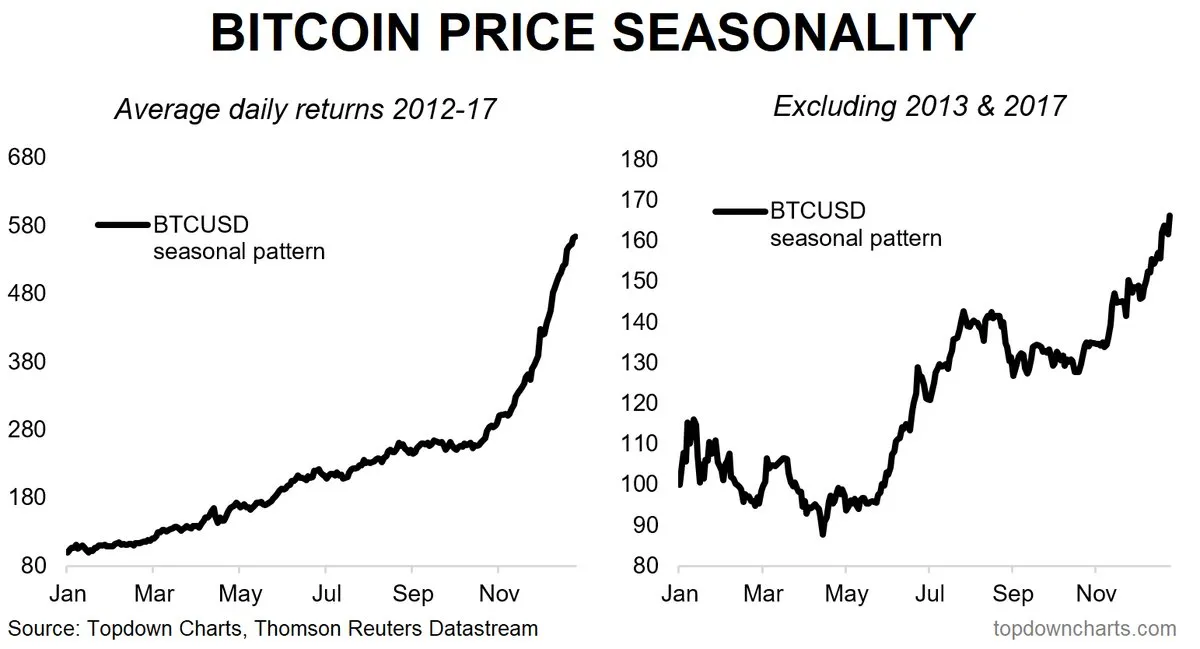
Based on the very limited data set we have for Bitcoin[2], a seasonal pattern has become evident over its 9 year history (Chart 2.). Most of the gains tend to occur in the second half of the year. Most of the selling has tended to occur around Christmas time and generally lasts until after Chinese new year.
This pattern would seem logical, as the respective festive periods tend to correlate to higher spending for you and I. So taking some money out of your savings pool to pay for Christmas presents etc. would make sense.
Chart 3.
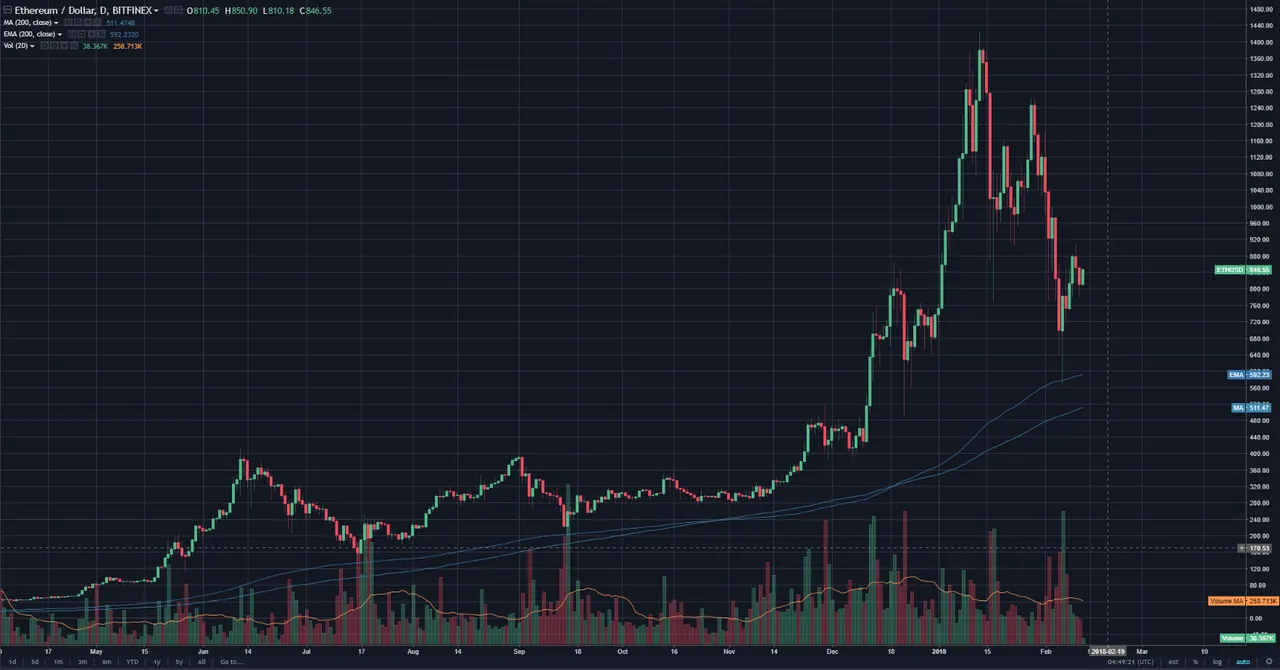
Bringing the altcoin[3] space back into the picture, we can see from chart 3. (Ethereum), and more clearly in the chart below, that the altcoins tend to correlate strongly with Bitcoin, following its general direction closely, but with varying lag times.
Chart 4.
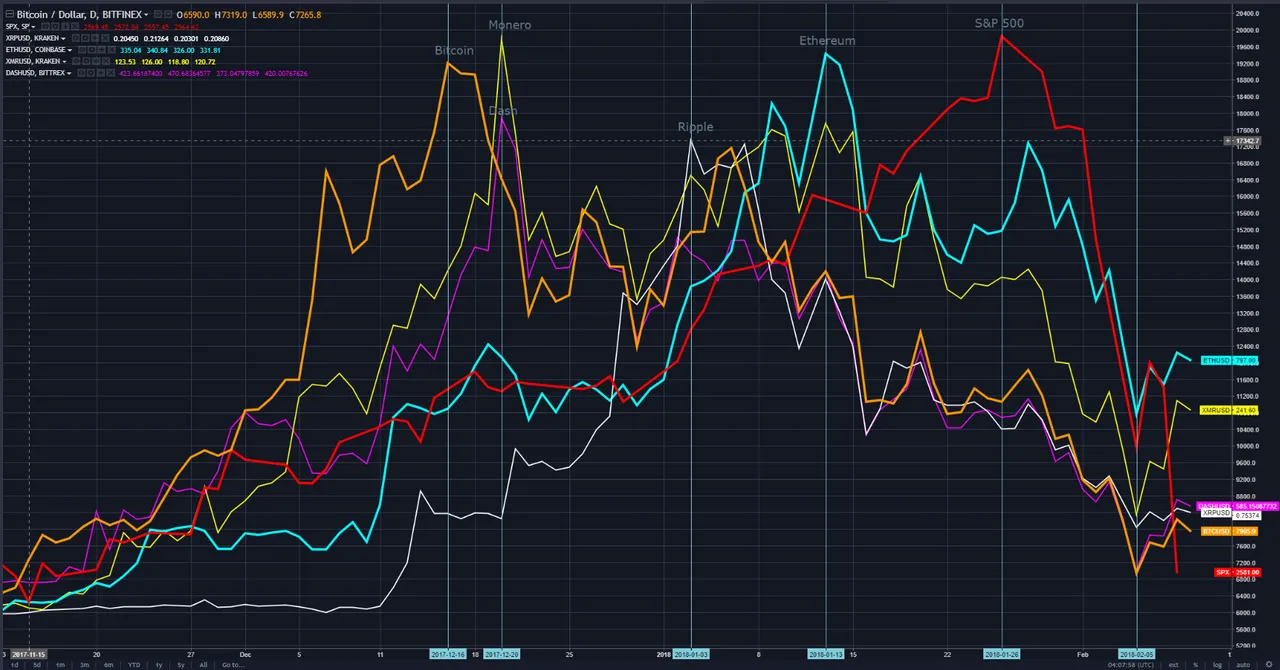
This behaviour seems to suggest that Bitcoin investors may be moving money out of Bitcoin, into the more speculative cryptocurrencies (E.g. Ethereum, Dash, Monero, Ripple, Cardano, etc.) either to participate in Initial Coin Offerings (ICOs), or chasing large percentage gains in lesser known, lower priced coins.
This makes intuitive sense to us, as many of these altcoins trade uniquely on Crypto-only exchanges, and in terms of Bitcoin/Ethereum. I.e. You cannot buy them with dollars, you must first buy Bitcoin or Ethereum in order to buy into certain altcoins (e.g. Cardano - ADA). Furthermore, it is widely understood that the majority of new entrants into the market start with Bitcoin - usually the only cryptocurrency they have heard of in the mainstream media and the easiest to access.
So a particularly smart and nimble trader, could have preserved their Crypto returns by moving through the cryptocurrency ecosystem. However, as of January 13th, the day on which Ethereum peaked, the entire Crypto space, re-joined Bitcoin (already in a bear market), falling in unison for most of January, until they found support on February the 6th.
There were plenty of news stories which contributed to the sell off:
Once again we had news out of China that authorities are stepping up their infamous clamp down on cryptocurrencies; this time, extending their reach to offshore exchanges in places like Hong Kong.
The US taxman, the IRS was very active over the period.
A large Japanese exchange, Coincheck, reported the biggest Cyber heist since Mount Gox, where over $500m was stolen from its clients' accounts.
Widely Known Crypto Ponzi Scheme Bitconnect shuts down.
An ambiguous report out of South Korea which seemed to suggest the Government was planning to ban all trading in the World's most active crypto market. In fact, they only required that SK exchanges implement AML/KYC checks on all traders.
Banks in the UK and US announced a ban on buying crypto on credit.
CME & CBOE launch Bitcoin Futures Contracts. Increased mainstream access and media coverage, and importantly provided a venue for large traders to go short.
The confluence of seasonality and an excessive amount of bearish newsflow in the mainstream media, led to an acceleration in the sell off and several consecutive days of double digit negative returns, and a sea of red on the front page of Coinmarketcap.com - the go to site for trading stats and info on cryptocurrencies.
The worst of the selling was arrested on February 6th, the day that Bitcoin crashed through its 200 day moving average (see Chart 1). The 200 day moving average has proved an important level for traders who have consistently accumulated Bitcoin when it is trading below this line. The green bar directly below the price line on February 6th, shows that a huge amount of buy orders traded when bitcoin breached this key technical indicator.
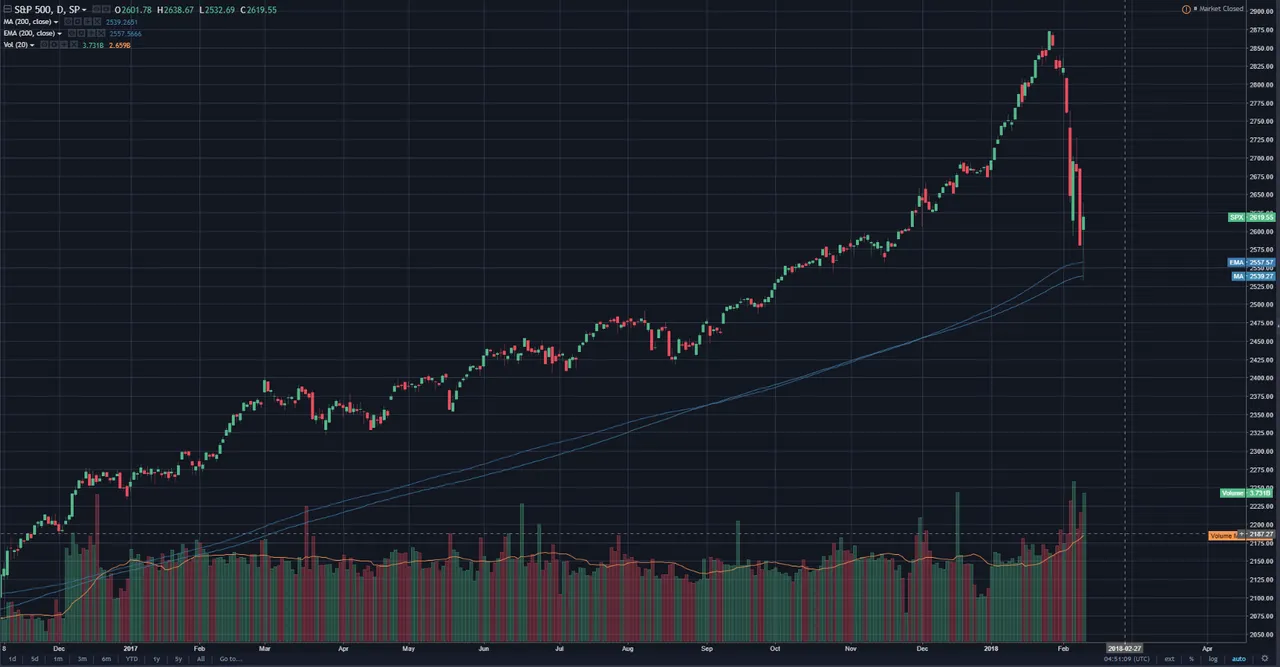
The keen chartists among you will have noticed the red line in Chart Four, the last line to peak and crash. This depicts the S&P 500, the US stock market, which for the past week, has undergone a savage correction following the implosion of several short volatility ETPs (Exchange Traded Product - e.g. ETF, ETN)[4].
Why have I included commentary on Fiat markets in a cryptocurrency article?
Chart 5.
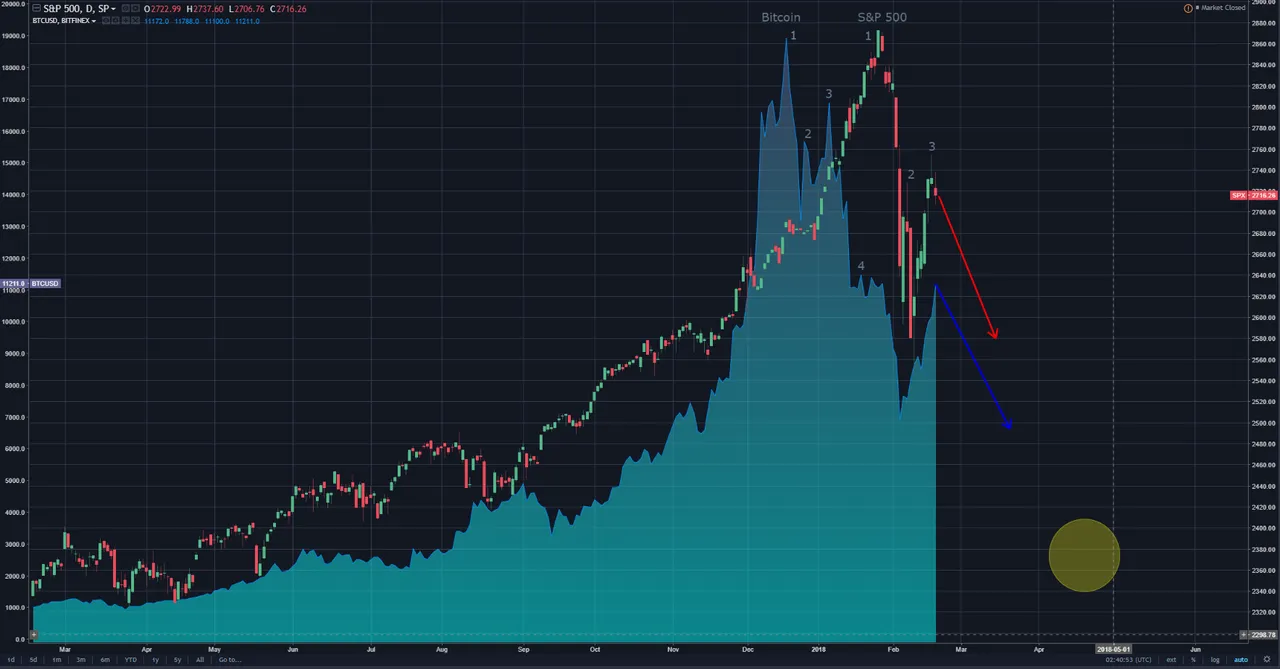
According to Datatrek's Nick Colas[5], Bitcoin's 90-day correlation to the S&P 500 is at all time highs. As Mr. Colas goes on to cogently explain after the jump, the correlation between Bitcoin and fiat financial markets has reached extreme levels.
This correlation issue is important, because many pro Crypto pundits would argue that investors should allocate a portion of their investment portfolio (usually 1%) to Cryptocurrency on the basis of its presumed diversification benefits. I.e. the mantra 'Bitcoin is like gold' and thus it should act as a hedge against inflation, and financial panic.
Emphasis on SHOULD, because, prior to last month, fiat financial markets had only gone up during Bitcoins history. I.e. this is the first time we can actually observe how bitcoin performs during a fiat market correction/crash. In reality, neither gold nor bitcoin proved as good a hedge for financial panic as many predicted they would be.
What to make of all this?
The fact is that the story is not over yet. Bitcoin can still evolve into a good inflation hedge and safe haven store of value as many hope. Right now, it remains unrealistic to expect it to trade with these properties, simply because the on ramp into the market is very steep.
I.e. it remains quite difficult to get access to Cryptocurrency markets. Doing so requires a substantial investment of time and effort for an individual investor, and is almost impossible for an institution to participate given the regulatory hurdles. As adoption rates improve, the market's infrastructure develops, and regulatory conditions improve, we believe that there will be a portfolio diversification benefit from holding Bitcoin et al. in the future.
What happens next?
In the short term, we are quite bearish. Already, our trading team have observed declining volumes as Asian markets remain in holiday mode for the Chinese New Year festive period. Despite the bounce we have seen over the past two weeks since we marked the lows on Feb 6th, internal trade flow analysis, news, seasonality and the latest price action point to further weakness ahead.
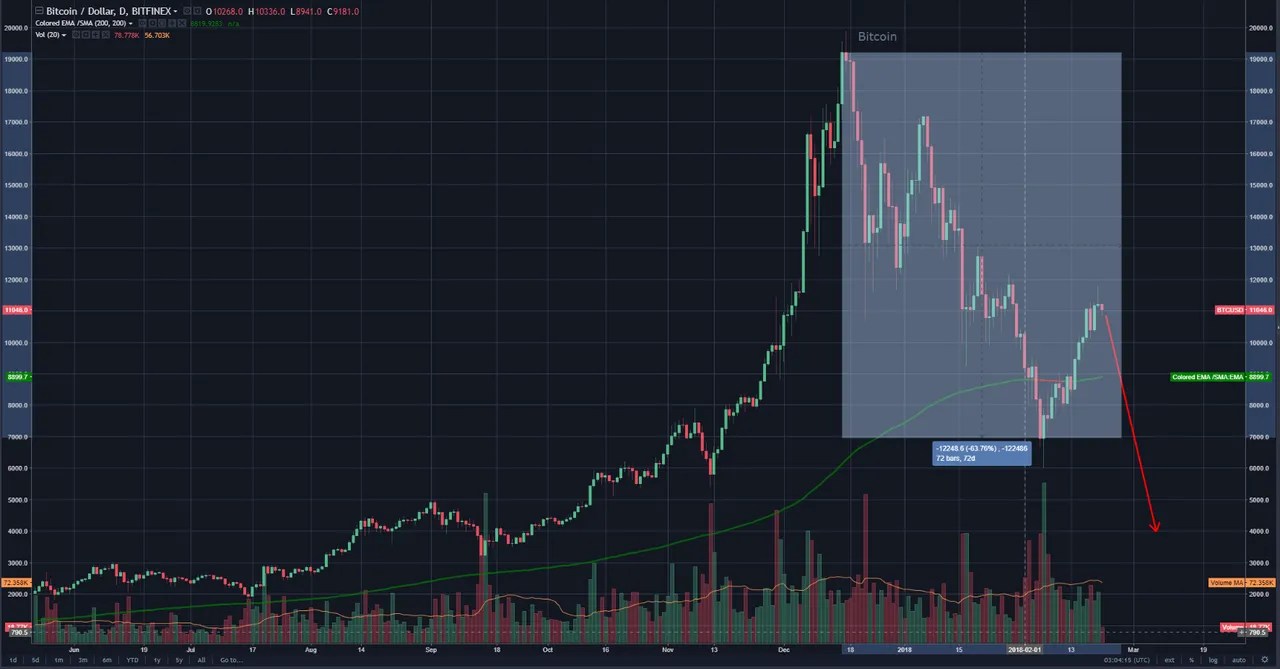
On average, Bitcoin bear markets (white box in Chart 6.) tend to see a 64% draw-down and last for approximately 72 days. We believe that a turnaround will come for bitcoin towards the end of march after the market has re-balanced itself bit further. Thus, we would not be surprised to see the price break the $4000 barrier to the downside before another bull run begins - many weak hands are yet to be flushed out. We would be very surprised to see BTC trade lower than $3000, and would certainly be comfortable accumulating at such levels.
Chart 6.
On a longer term outlook, the future is definitely bright for Bitcoin and cryptocurrencies more broadly. The truly staggering amount of innovation in the space is certain to provide investors and traders many opportunities to make significant returns. A successful mainnet launch of the BTC Lightning Network could be a real positive catalyst this year.
We are rather more bearish on Ethereum and traditional financial markets in the coming weeks. It would appear to us that if, Bitcoin is a leading indicator for all other Crytpos as well as the US stock market, that there would seem to be plenty more downside still to come in these markets.
Chart 7.
Look out below.
** This article was originally posted to our company blog on Friday 16th February. The Steemit version has been updated to include the recent price action and some additional commentary. Thank you for reading.
[1]: HODL - Misspelling of the word HOLD in an early Bitcoin forum that became its own meme and was retroactively transformed into an acronym representing the phrase: Hold On for Dear Life.
[2]: Disclaimer - Huge caveat here. Bitcoin has only been around since 2009, so trading based off of historical seasonality patterns is not recommended. Past performance is no indication of future returns!!
[3]: ALTCOIN - Refers to any cryptocurrency or token that is not Bitcoin.
[4]: Please comment - For more on what's going on in fiat markets.
[5]: Datatrek - I was fortunate to work at the same firm as Mr. Colas in my final year as a global macro strategist, covering sell side institutional clients, back in 2016, before he left to found his new research firm Datatrek. He is a widely respected for his out-of-the-box thinking in traditional financial markets, a frequent Bloomberg/CNBC contributor and is credited with being the first traditional financial market pundit to write about Bitcoin and the cryptocurrency space in general.