
ETHUSD
With BTC going parabolic and reaching new All time highs it is still important to keep our eyes on ALT currencies. Today we will look at ETHUSD as we have been tracking the wedge formation for some time now.
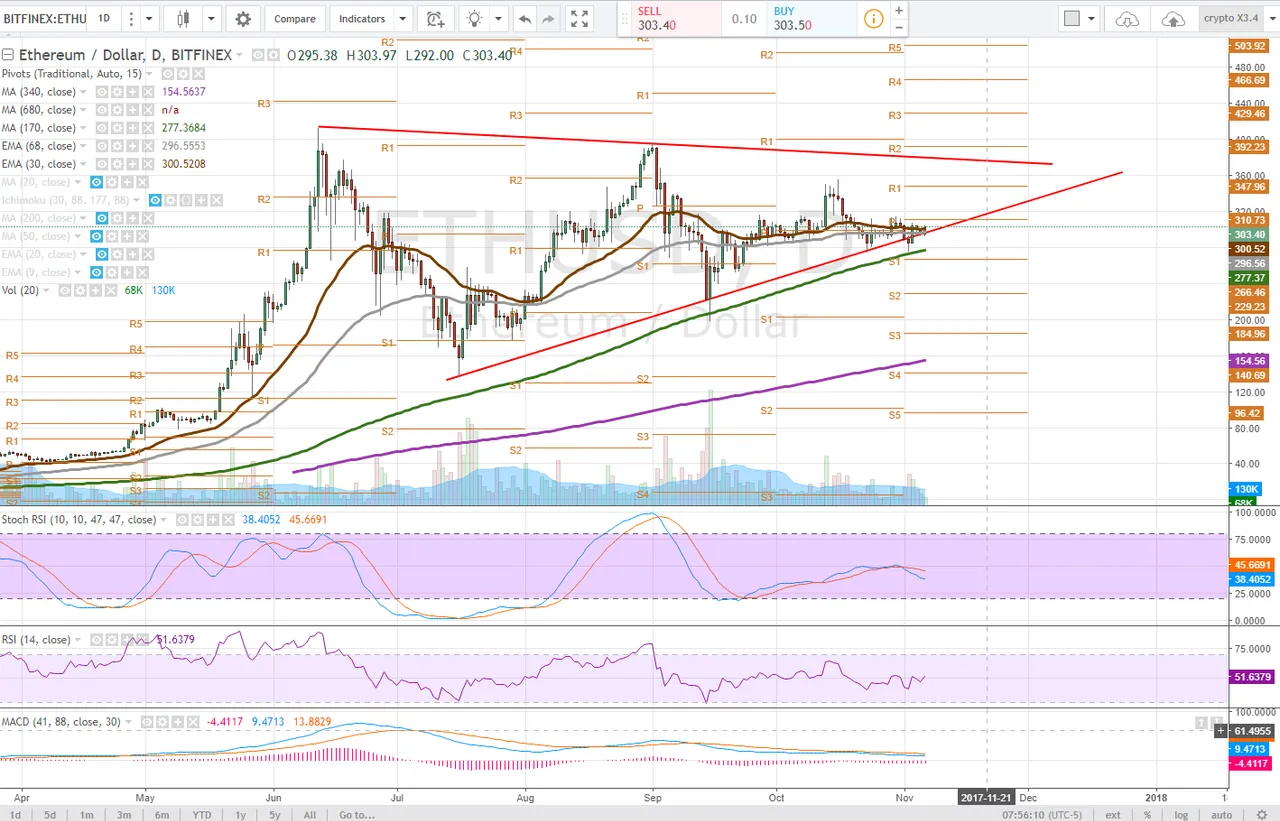
Daily
The price of ETHUSD briefly broke the lower trendline before catching support just above the 170dma on the daily time frame. Maintaining this wedge formation is extremely condusive to price progression.
The stochastic RSI and RSI have continued to trend sideways as the moving averages converge to a tighter range. The MACD is hanging just below the zero line as the 30ema and 68 ema are proving to be a difficult resistance to break above. Bulls are looking for the price to claim the 30ema as support and test the daily pivot, $310.73
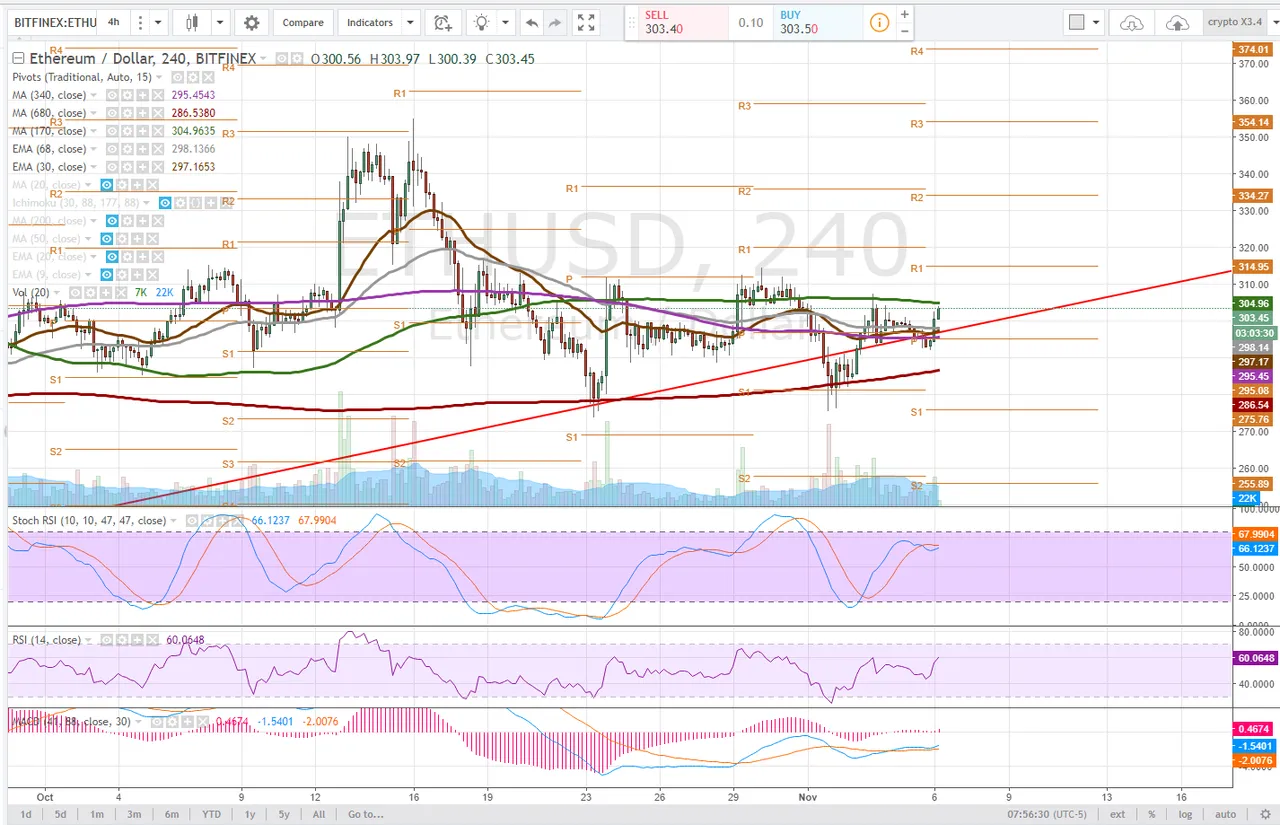
4 hour
On the 4 hour time frame the Stochastic RSI and RSI have begun to trend upwards after a bullish MACD cross. Resistance is clearly observed at the 170dma. This is a critical level for bulls to reclaim after the price tested and bounced off of the 4 hour pivot. It is also observed that a double bottom was set at approximately the 680 DMA on this time frame. Should the price pullback and lose pivot support, it is critical that the 680dma be maintained. If the price can reclaim the 170dma bulls should look for a test of pivot r1 on this time frame and look for consolidation thereafter, approximately $314.
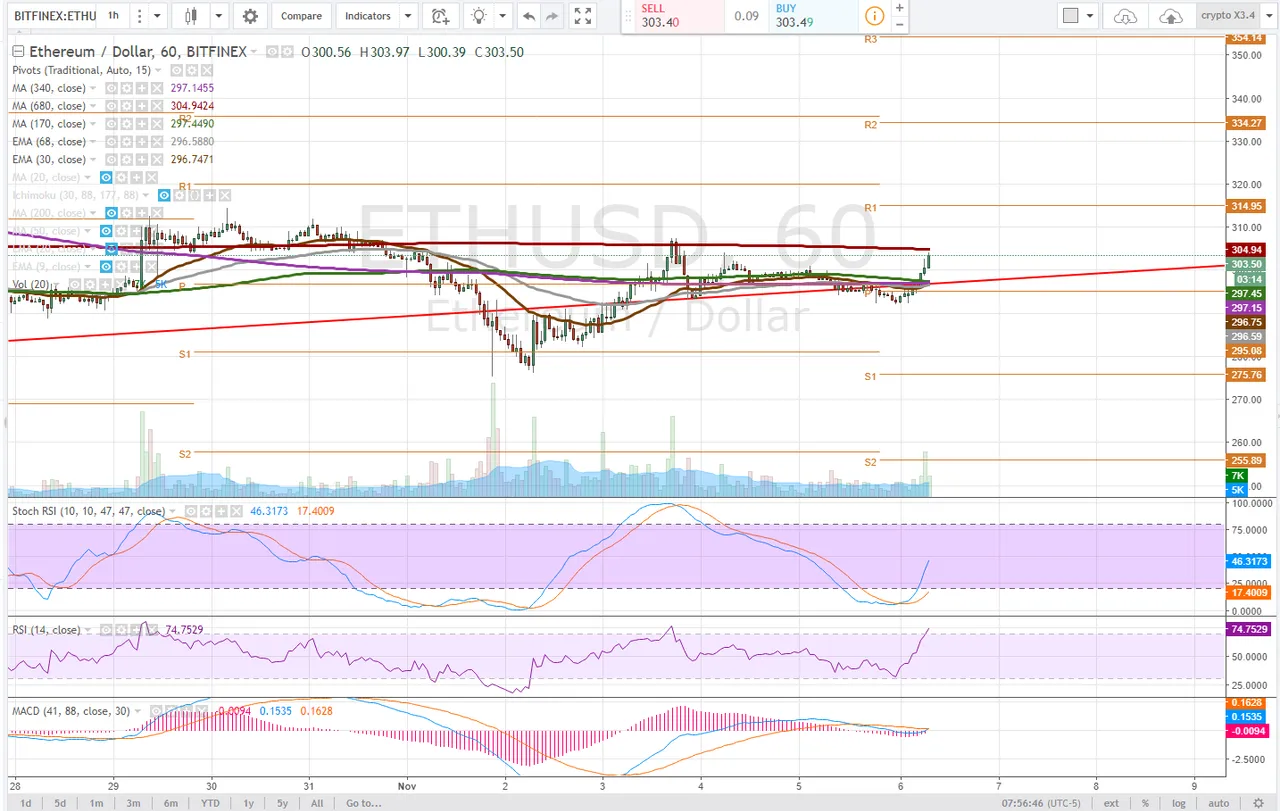
1 hour
The 1 hour time frame is most interesting with a bullish MACD cross appearing to be imminent as the stochastic RSI has curved steeply upwards. Some caution is warranted as the RSI has just reached overbought. An increase in volume has led this shift in our momentum indicators and resistance is observed at the 680dma on this time frame. A bullish convergence of the other moving averages is underway and continued momentum will drive the 30ema and 68ema upwards to act as price support. This has all occurred again after testing the pivot on this time frame.
Pivot R1 is as well $314 on the 1 hour and would be a reasonable target to look too before price consolidation if the bulls can maintain this momentum.
Bullish Above: $305
Bearish Below: $294.50
RISK TRADE: Scale into a long position and be ready to add on a break above $305 or close if the price loses pivot support on the 1 hour time frame.
Don't forget to use stop losses!!!
Previous Articles:
BTCUSD
BCHUSD
ZECUSD
LTCUSD
BTCUSD
ETHUSD
BTCUSD
LTCUSD
XMRUSD
Follow at your own risk, Not a financial adviser, understand the risks associated with trading and investing. Manage your own Risk - in other words you could lose it all and it's your own fault.