BTCUSD - Day Traders Chart Setup
Moving averages:
Green = 50dma
Red = 200dma
Orange = 9ema
Black = 20ema
Typically I have been presenting a swing traders chart setup to steemit users and providing possible setups. Today we are going to analyze the day traders chart set up, this chart is typical for tracking shorter term moves. The reason i normally use a time adjusted chart for cryptos is to essentially smooth the curve and hopefully provide safer trade ideas.
Bitcoin after reaching 7500 has given it all back and failed to reclaim the daily pivot R1 going on 72 hours now. This chart setup itself is showing a longer term bearish reversal in the works. The purpose of sharing this analysis today is because of the extreme volatility we have observed in bitcoins price swings - I personally cannot wait for a volatility index on bitcoin to play, but I digress...
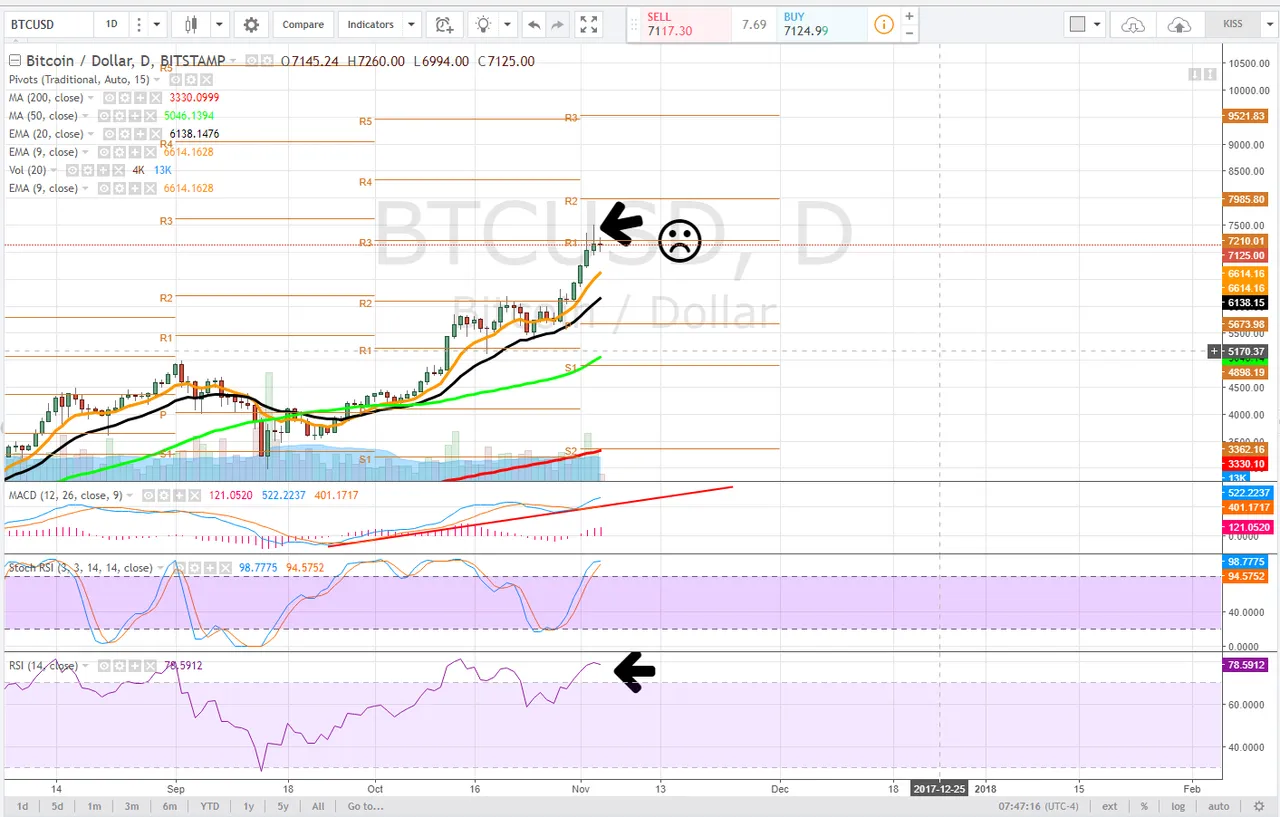
Daily
On the daily time frame, we have observed a series of lower highs and lower lows going on the 3rd day here. In order for bitcoin to remain bullish traders and investors need to see the price back above pivot R1approximately $7210. and reconfirm this level as support - consolidate on it.
The stochastic RSI on this timeframe has extended upwards driving the RSI once again into extreme overbought territory. The MACD has been trending upwards and is historically extended above the zero line. Falling below the clear trendline would confirm a bearish reversal in momentum. It is still important to recognize that nothing goes straight up forever, and price progression is as well a function of price verification. On the daily time frame, we are looking for a test of the 9ema (orange) and if it fails the 20ema (black). The bear case for a correction would target the daily pivot, approximately $5656.
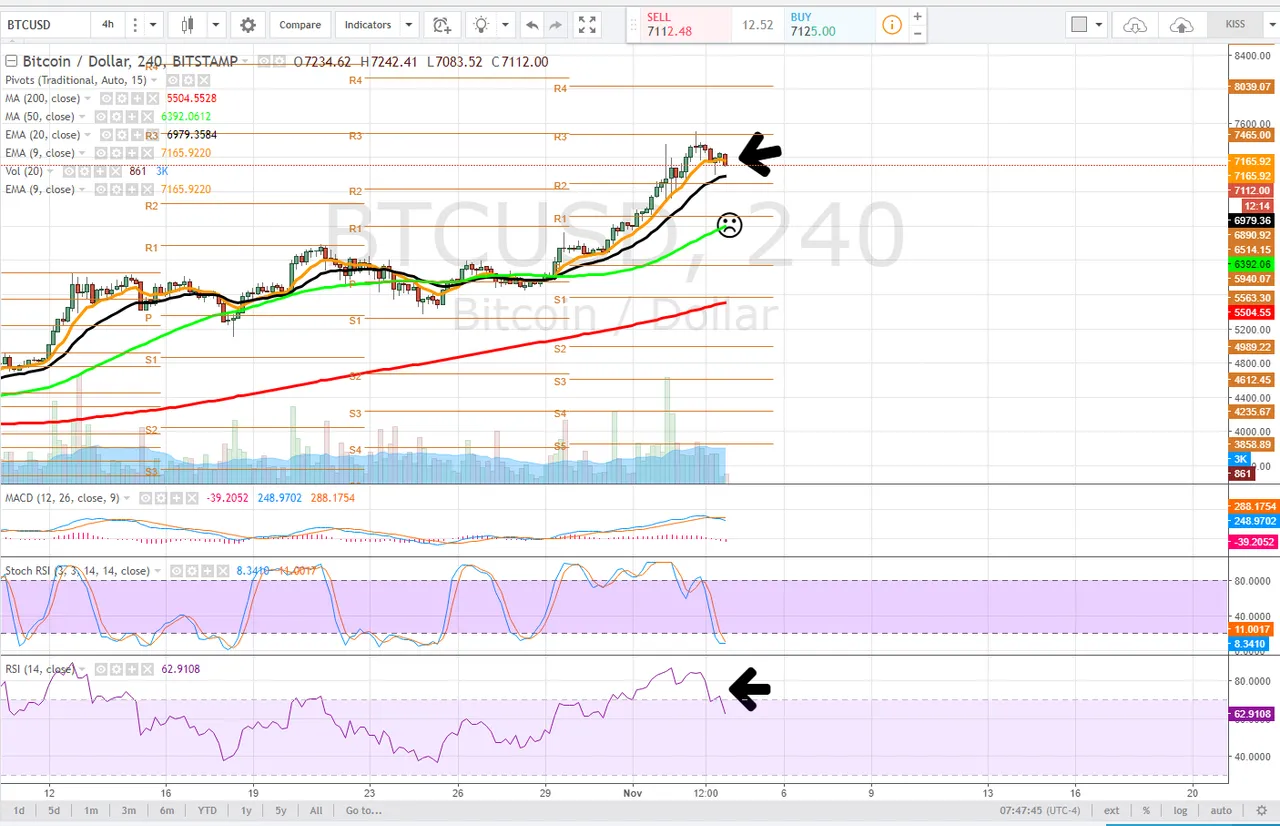
4 hour
The 4 hour time frame is looking a little worse for the wear, as the price is repeatedly failed to reclaim the 9ema (orange) on this time frame. Next target before any kind of real relief pop is the 20ema (black) approximately $6979.
The Stochastic RSI has just fallen into downtrend where it is driving the bearish MACD cross, this all suggests in the short term, bullish momentum has waned. If the price cannot maintain PIVOT R2 on this time frame, approximately $6890, we would look for a test of the 50dma (green) and pivot r1, approximately $6514 where it appears the 50dma will converge.
Very bearish would be the 9ema falling below the 20ema.
The RSI has also begun a sharp drop from its extreme overbought conditions and may begin to trend lower on the 4 hour as it has in the 1 hour time frame.
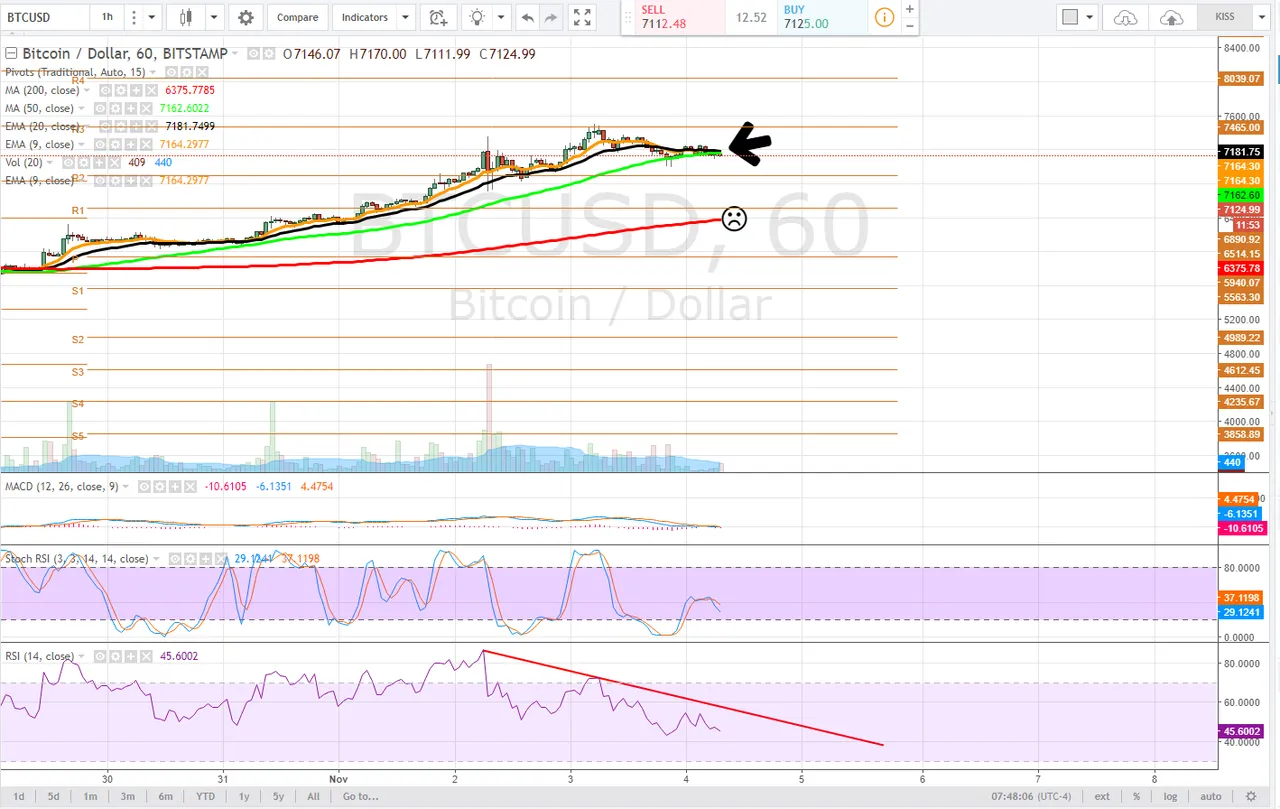
1 hour
On the 1 hour time frame a bearish convergence of the shorter period moving averages to the longer period moving averages has occurred as it appears the 9ema and 20ema are moments away from falling below the 50dma. This is how traders use moving averages to determine potential trend shifts.
As this bearish moving average convergence occurs expect some light volatility and a possible bull trap which could give way to a test of pivot R2 on the 1 hour, $6890. It is essential for bulls to hold these levels as if the price cannot maintain and begins to set a series of lower lows a test of the 200dma (red - $6375) is very likely.
On the 1 hour a down trending RSI is very obvious and coincides with the bearish moving average convergence, with the stochastic RSI barely able to push higher before it ultimately reverses into a bearish cross. The MACD on this time frame is quite lame as the bulls are just not showing up to the party which is typical to observe, again when the moving averages begin to make bearish convergence.
It is important to recognize that moving averages are a backward-looking indicator as they are dependent on historical data, but that doesn't mean they cannot be used to reliably determine areas of support and resistance.
Bullish Above: $7220
Bearish Below: $7080
RISK TRADE: Scale into a short position, if using leverage, cautiously do so as shorting is still quite risky. We are at what is known as a point of inflection
Don't forget to use stop losses!!!
Previous Articles:
BCHUSD
ZECUSD
LTCUSD
BTCUSD
ETHUSD
BTCUSD
LTCUSD
XMRUSD
Follow at your own risk, Not a financial adviser, understand the risks associated with trading and investing. Manage your own Risk - in other words you could lose it all and it's your own fault.