Bitcoin @14000$
Let's analyze the possible market movement Using one of the most effective and simple candlestick naked chart analysis.

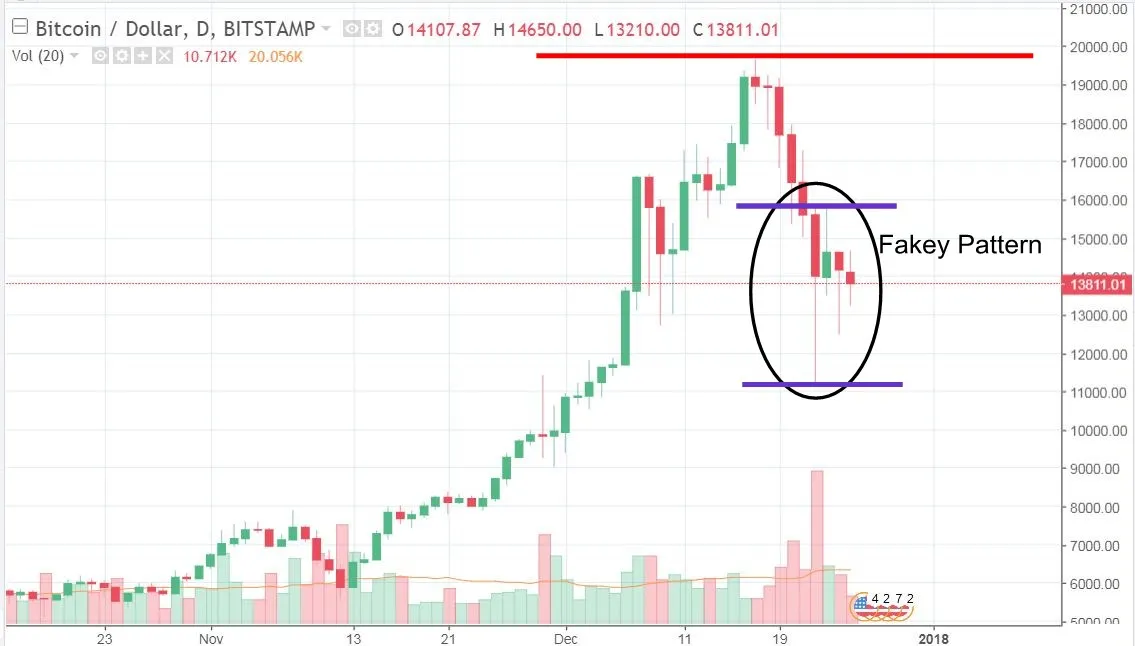
Above pictured chart with Daily timeframe shows the price to be range bound inside fakey pattern.
The Blue lines are the support and resistance zone where market is range bound, a break above or below may form a new price action wave.
Also see the red line that will act as the major resistance in future because of being the highest level of all time.

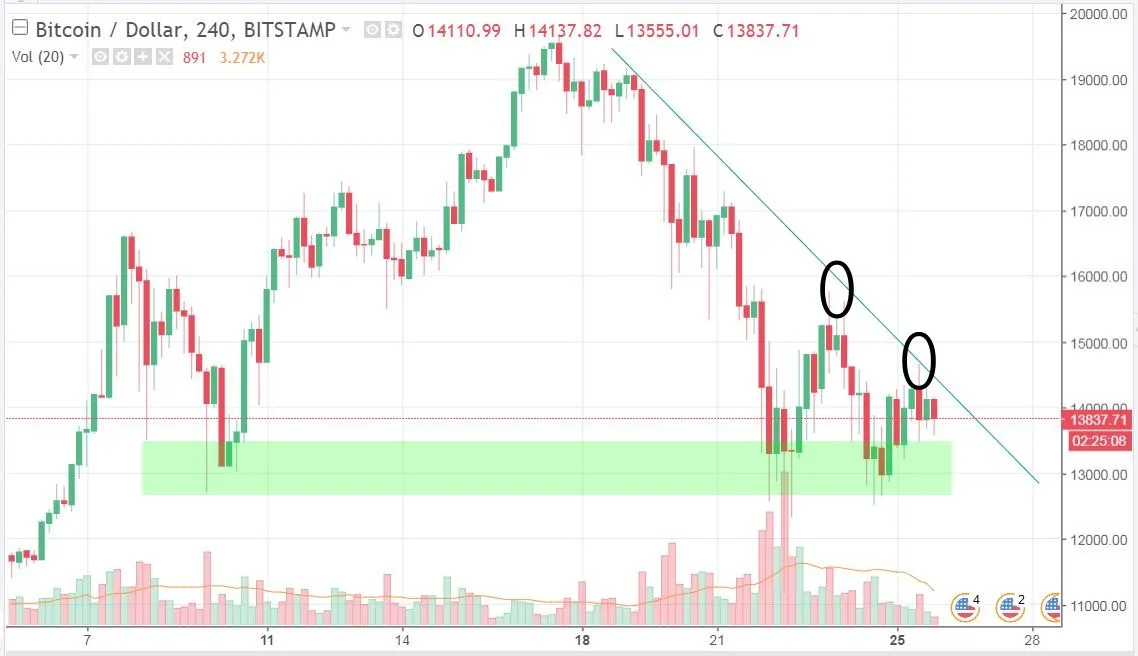
Now moving on to the lower timeframe i.e, 4 hours
the price seems to be downtrend being testing the green trendline again and again. a break above this trend line will lead the price towards 16000+ level.
the green area at the bottom shows the possible double bottom which is another effective price action formation.
The green area is also making H&S pattern. this is the main area to watch closely a break below could be dangerous for bitcoin price.

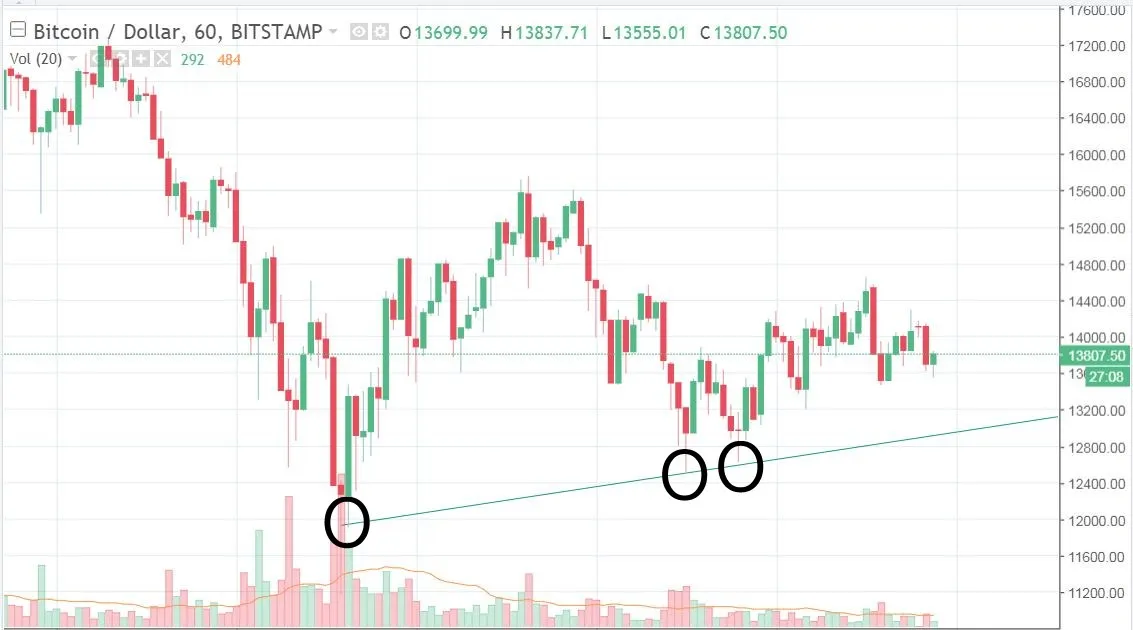
And finally moving on to the hourly timeframe we have a minor uptrend, smoothly testing trendline for upward move, if the price stay above trend line and keep going it will hit 16000$ level soon.
Please note that market is sideways today because of holiday, tomorrow as soon as the world markets will open the price will show volatility.
Please follow me @mohsee74 for more analysis and trading ideas.