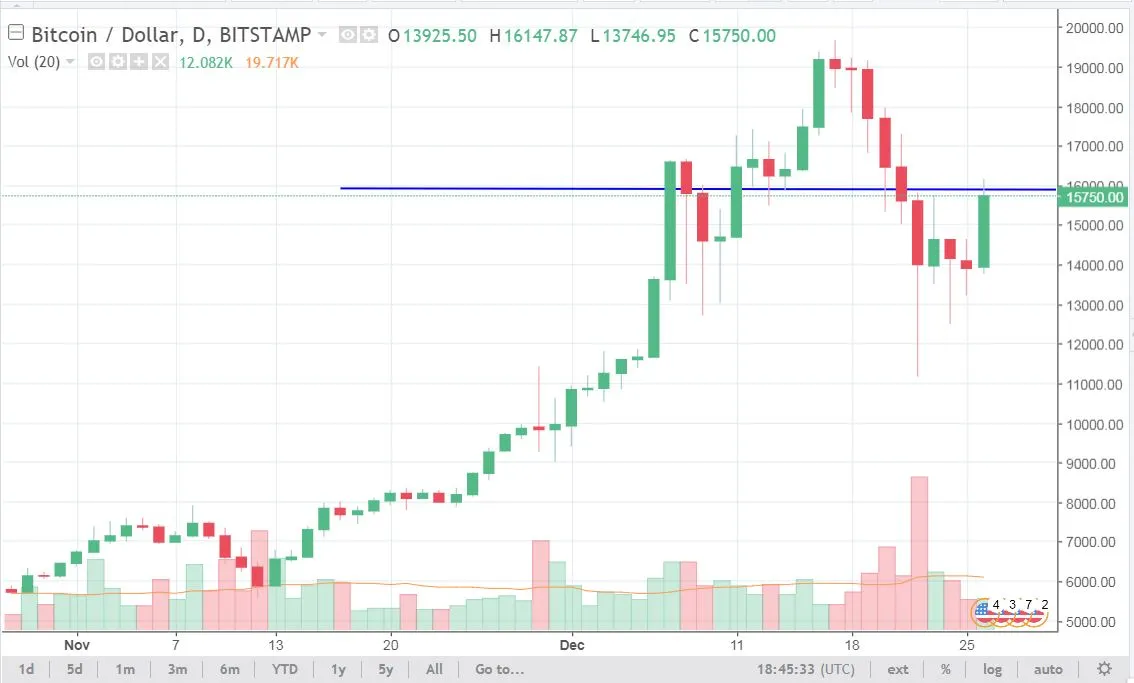
Above is the picture of Bitcoin daily chart, As it can be seen the price is almost at 16000$ following my yesterday's post hourly trendline move. Now the market is testing major resistance level at 16000$ level.
If the daily market closes above blue line (16000 level) then the next resistance is at 17400 and 19700 level
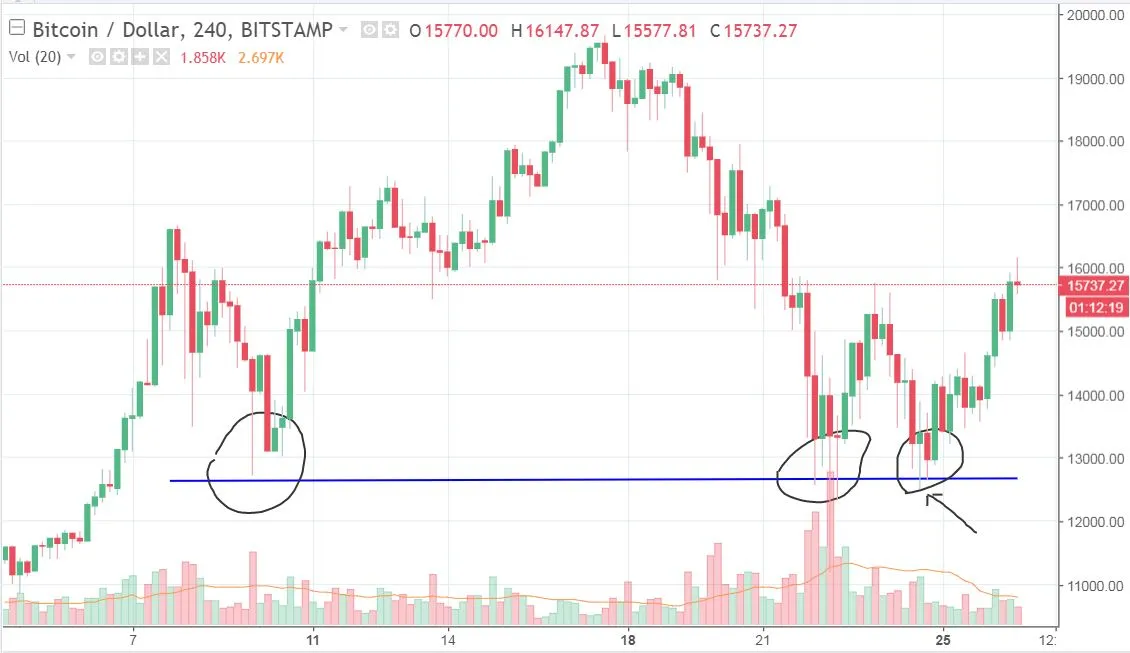
Let's have a look at smaller timeframe to check current market condition.

On 4Hours chart we can see the price bounced from our H&S pattern support zone but still its at pivot level and we need to watch market closing.
Pivot Level: 16000
Major Resistance: 17500 , 19700
Major Support: 12700 , 11800