Bitcoin is down again after hitting almost 15000+ level yesterday.
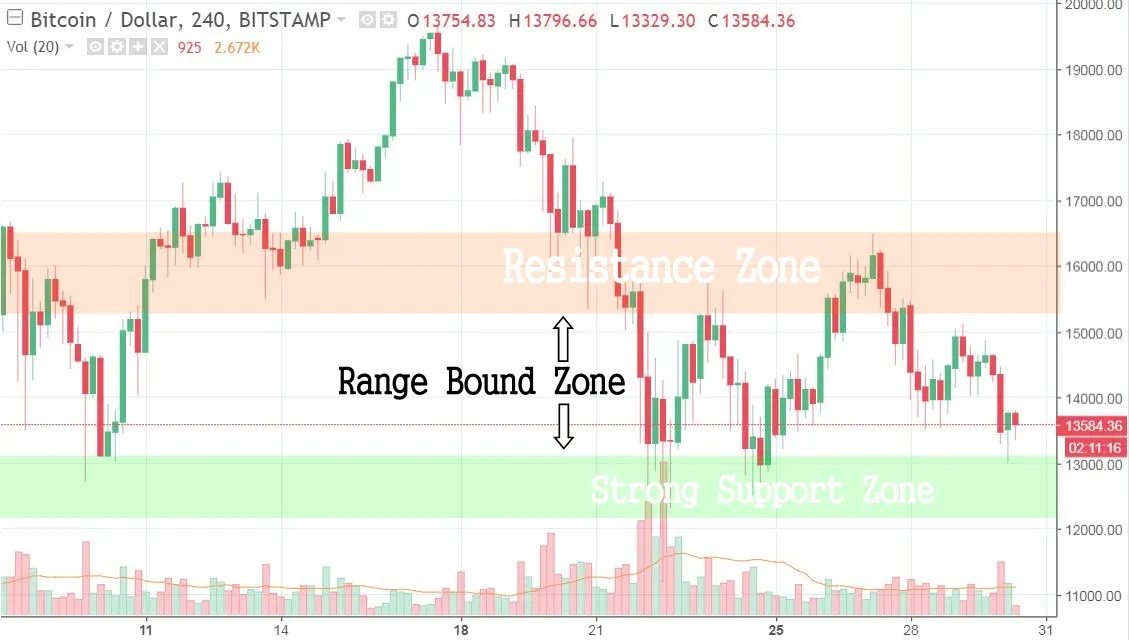
Above shown is the 4 Hours chart and it can be seen that price is range bound after forming head and shoulder pattern. it can also be seen that we have a tripple bottom which is strong support at the moment.
13000$ is the best level to buy i have mentioned earlier in my posts as well.

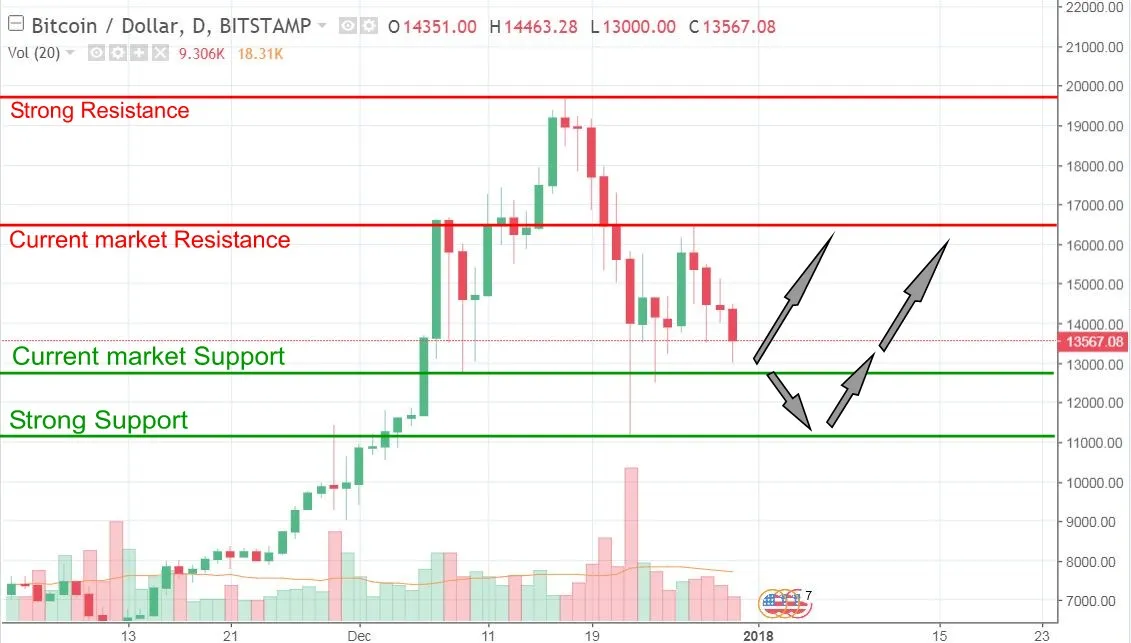
Now lets have a look at daily chart.
I have split the zones into support and resistance lines to explain properly.
Current market support: 12750
Strong Support:11200
Current market Resistance: 16500
Strong Resistance: 19600
let me clarify that technically current market support or resistance is nothing, but i used it to explain the closest points near to market that which market is supposed to hit to shows price action moves.
Buying between support zone 12500-11200 is best strategy at the moment.
Remember we are already down after hitting 19660 level so we may possibly see a bullish move now. Maximum pullback expected is 12200 level because it's 38.2% which is the most effective fibo retracement level.
Thanks for Reading.
Please Upvote and Resteem