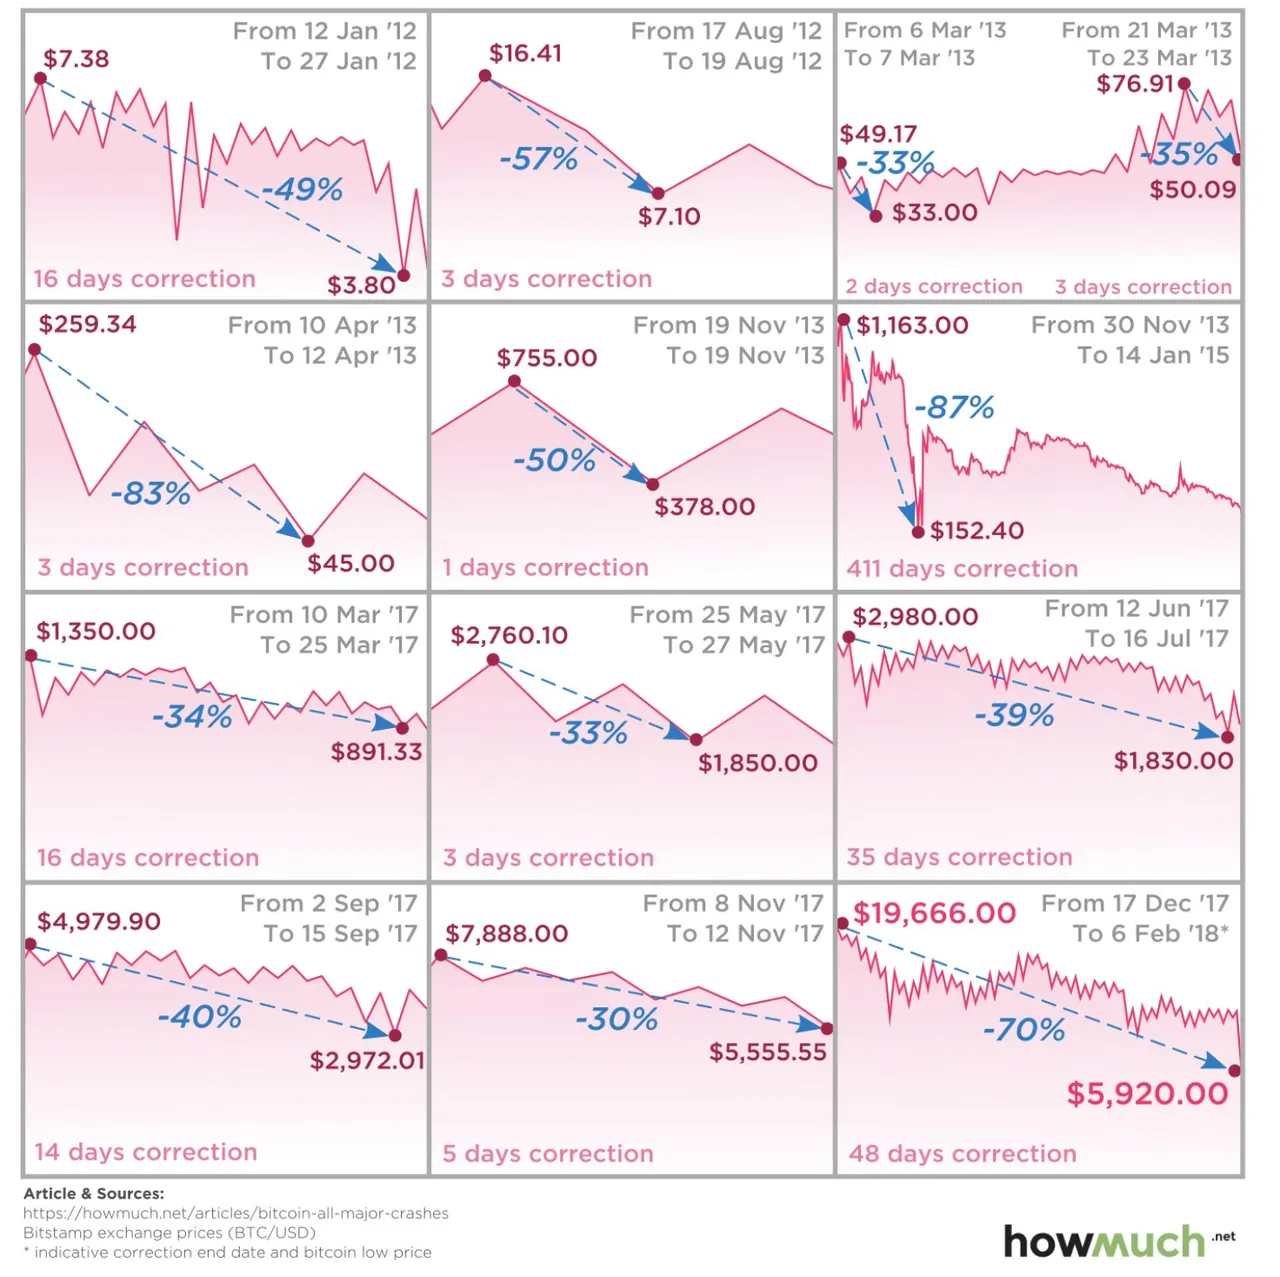
Bitcoin prices have crashed or lost it's value by 30% or more 9 times. Biggest correction took 411 days which started in Nov'13 and lasted till 14th Jan'13 where it dropped from $1163 to $153 losing 87% of its value. We're currently have lost 55% in last 90 days.

This Is Not Bitcoin’s First Rodeo, Top Crypto Has History Of Surviving Crashes
Despite the steep 70% losses during the latest cryptocurrency sell off, this is not an unusual event for Bitcoin. Since January 2012, there have been thirteen major corrections or crashes in Bitcoin, including this latest rout. Losses have been as minimal as 30% and as severe as 87% during these Bitcoin panics. Compared to its past events, this latest correction was not even as severe or painful as it has been in the past.
The latest correction took place between December 17, 2017 and February 6, 2018, or 48 days, in which 70% of Bitcoin value was lost. However, if you look at the period between April 10, 2013 and April 12, 2013, Bitcoin lost an astounding 83% of its value over a three-day period. Talk about a panic! The point is that crashes have become relatively common throughout the cryptocurrency market, which is known for its swift volatility. It is important to turn to data and the facts in times of turmoil, rather than relying on one’s emotions.
Here is a breakdown of the visual, showing each of the corrections in Bitcoin by date of occurrence. It will also include the percent of value loss and the length of the correction in number of days:
- January 12, 2012 – January 27, 2012, -30%, 16 Days
- August 17, 2012 – August 19, 2012, -57%, 3 Days
- March 6, 2013 – March 7, 2013, -33%. 2 Days
- March 21, 2013 – March 23, 2013, -35%, 3 Days
- April 10, 2013 – April 12, 2013, -83%, 3 Days
- November 19, 2013 – November 19, 2013, -50%, 1 Day
- November 30, 2013 – January 14, 2015, -87%, 411 Days
- March 10, 2017 – March 25, 2017, -34%, 16 Days
- May 25, 2017 – May 27, 2017, -33%, 3 Day
- June 12, 2017 – July 16, 2017, -39%, 35 Days
- September 2, 2017 – September 15, 2017, -40%, 14 Days
- November 8, 2017 – November 12, 2017, -30%, 5 Days
- December 17, 2017 – February 6, 2018, -70%, 48 Days