
Hello guys, I tried to find as many chart patterns as I could on the BTC/USD chart and here is all of the patterns I came up with:
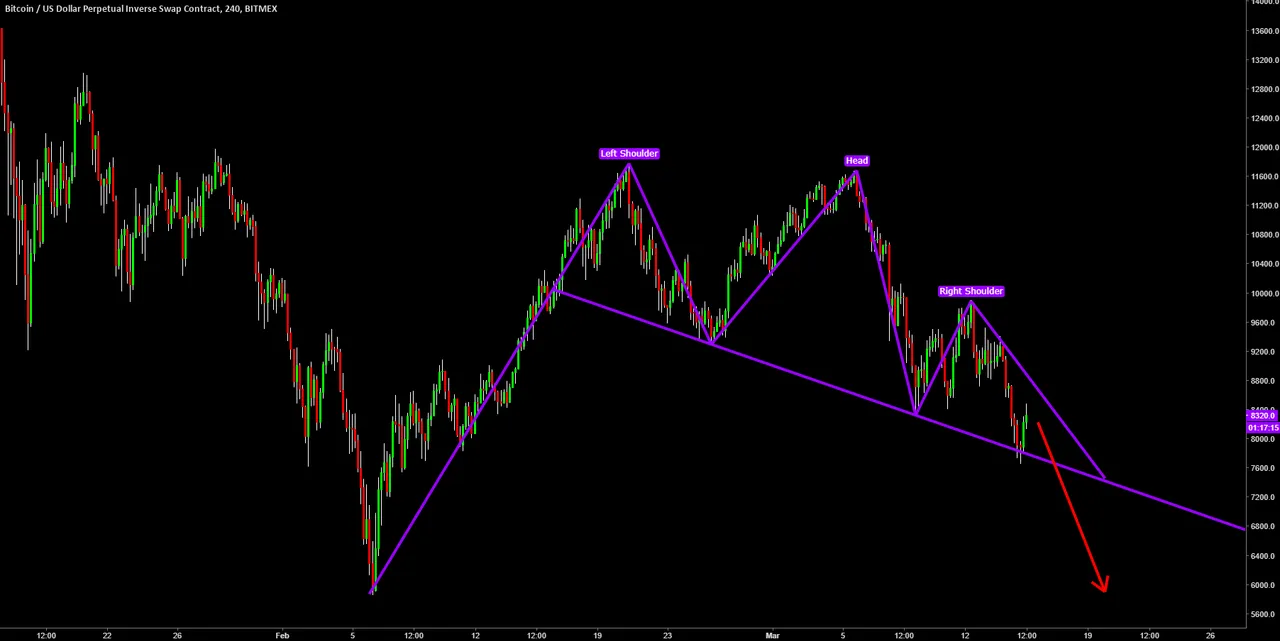
Head and Shoulders
(Zoomed out)

(Zoomed in)
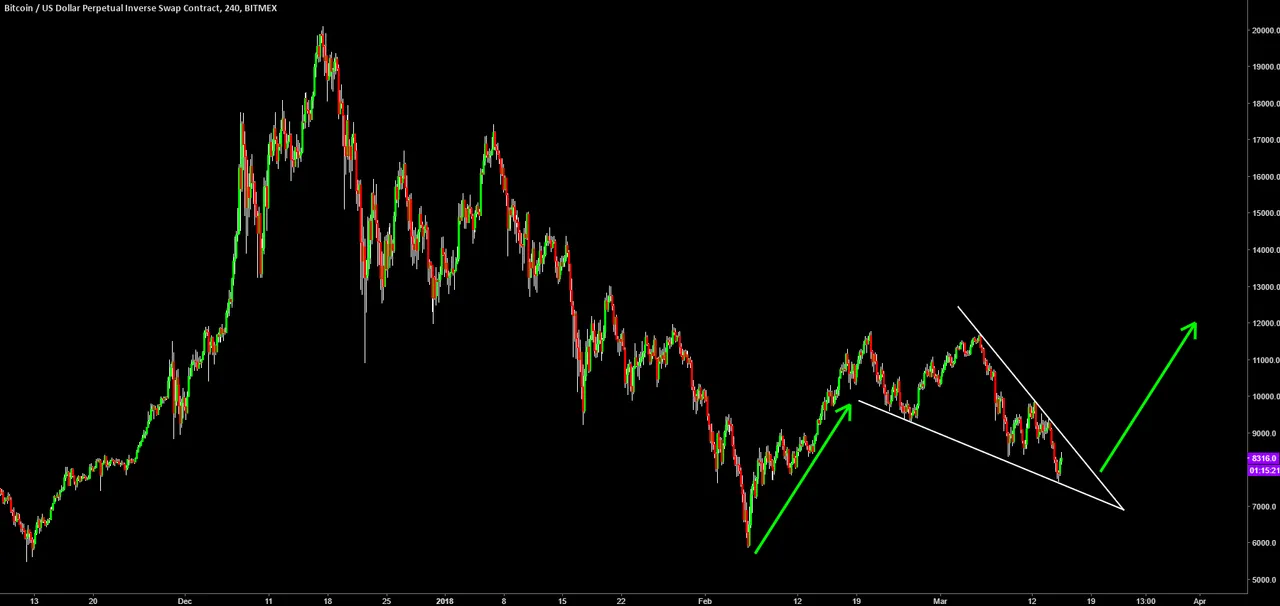
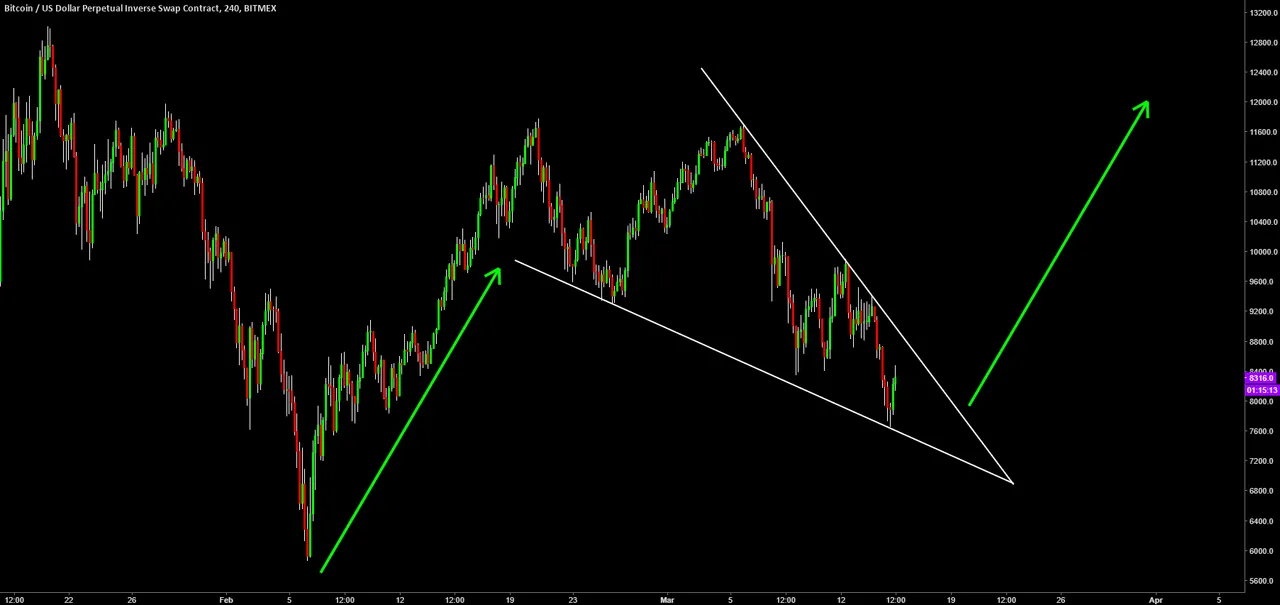
Falling Wedge
(Zoomed out)
(Zoomed in)
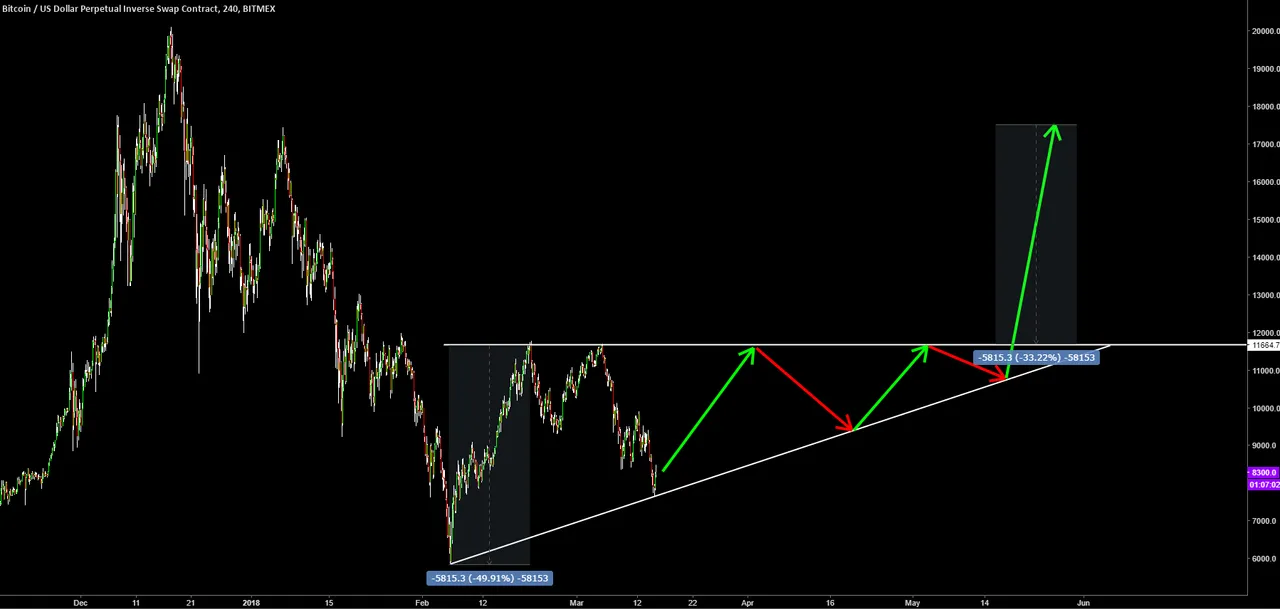
Ascending Triangle
Double Top
(Zoomed out)

(Zoomed in)

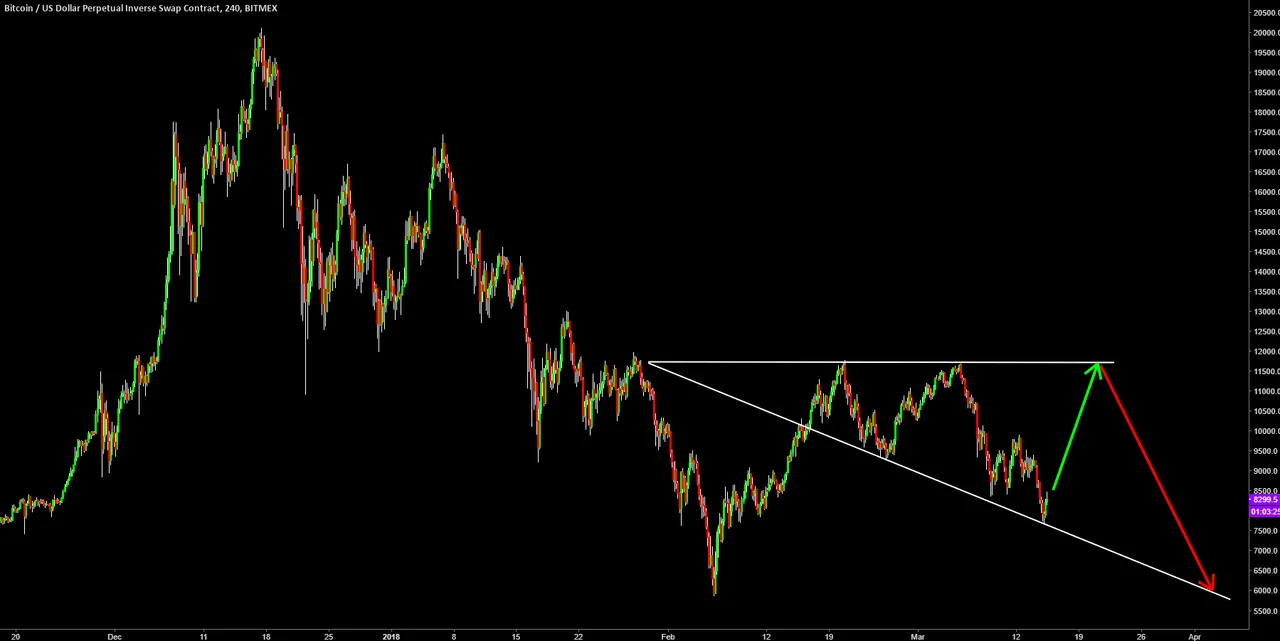
Descending Triangle
(Zoomed out)
(Zoomed in)
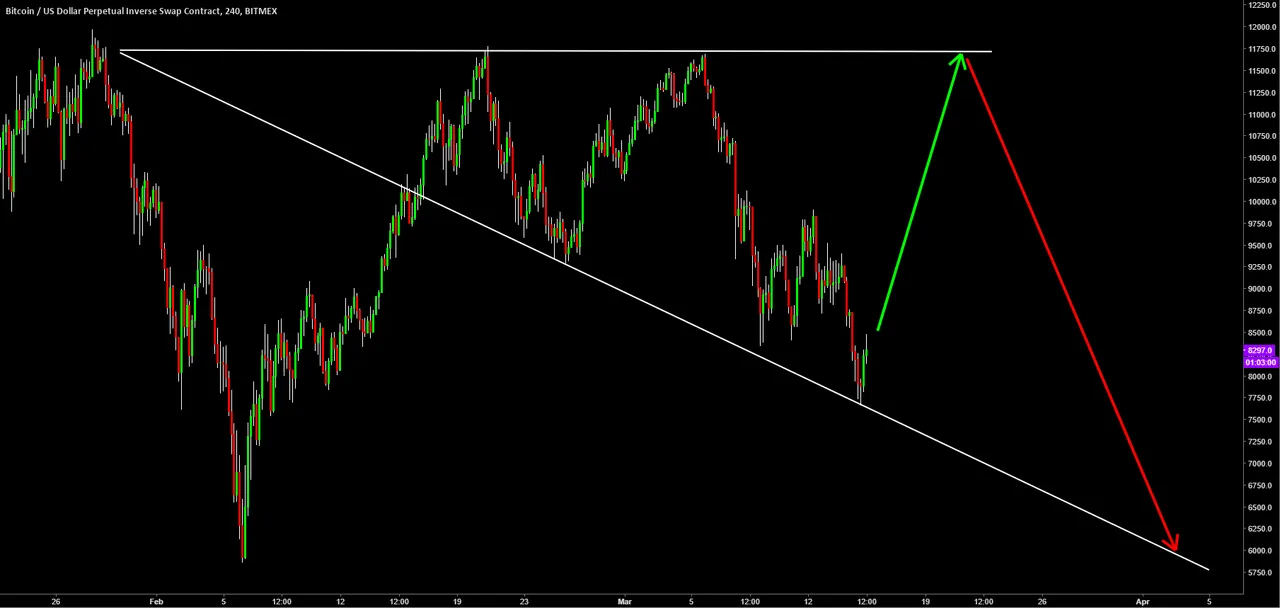
Well there ya have it people, there are a million BTC/USD chart patterns right now and I have no clue which one will play out, lol! The Head and Shoulders and Double Top Pattern say that we still have more downwards moving incoming, but the Falling Wedge, Ascending Triangle and Descending Triangle say we should have a move up from here.
Overall, I would say if price closes below $7,500 then we would most likely see more downward movement to at least $7,000 and maybe even $6,000. On the other hand, if price was to go up from here and close above $9,500 then we could see $11,700 again (where price formed the double top).
Anyways, thanks for viewing and have a nice day :)

Legal Disclaimer: This is just my analysis and not to be taken as professional financial advice. Do your own research beyond what you read in my blog posts and make your own decisions based on your beliefs about what to invest your money in.