Today I found a simple but strong evidence that bitcoin can fall to $4k until end of June.
비트코인이 6월 말에 4천불까지 하락할 수 있는 간단하지만 강한 증거를 찾았습니다.
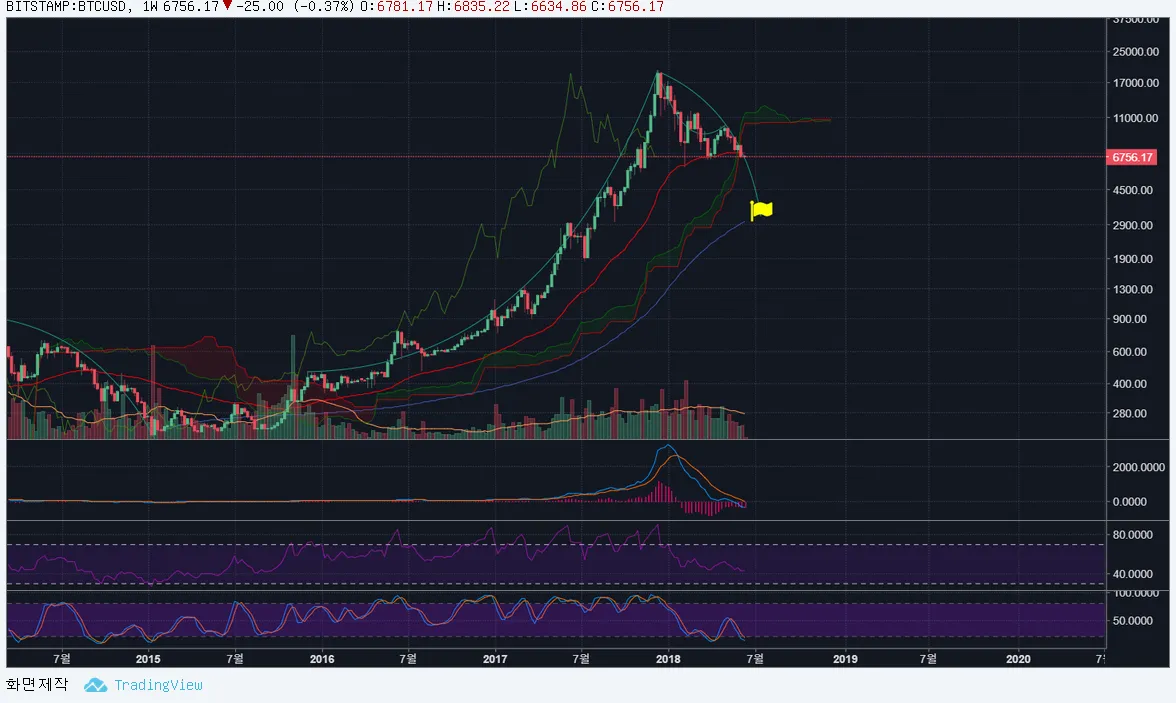
The evidence is parabolic green line shows below.
증거는 아래 차트에 보이는 초록색 파라볼릭 라인입니다.
This line is acting as both resist and support of the price.
라인은 저항 또는 지지의 역할을 둘다 수행합니다.
- Weekly chart (주봉)

The green line is acting as strong resist at the recent short term peak.
초록선은 강한 단기적으로 강한 저항선역할을 하고 있어 주봉이 맞고 떨어져 하락중입니다.
And the target price is $4k when this green line is meet to 120 EMA line.
목표가는 초록선이 주봉 120 ema 선과 만나는 4천달러입니다.
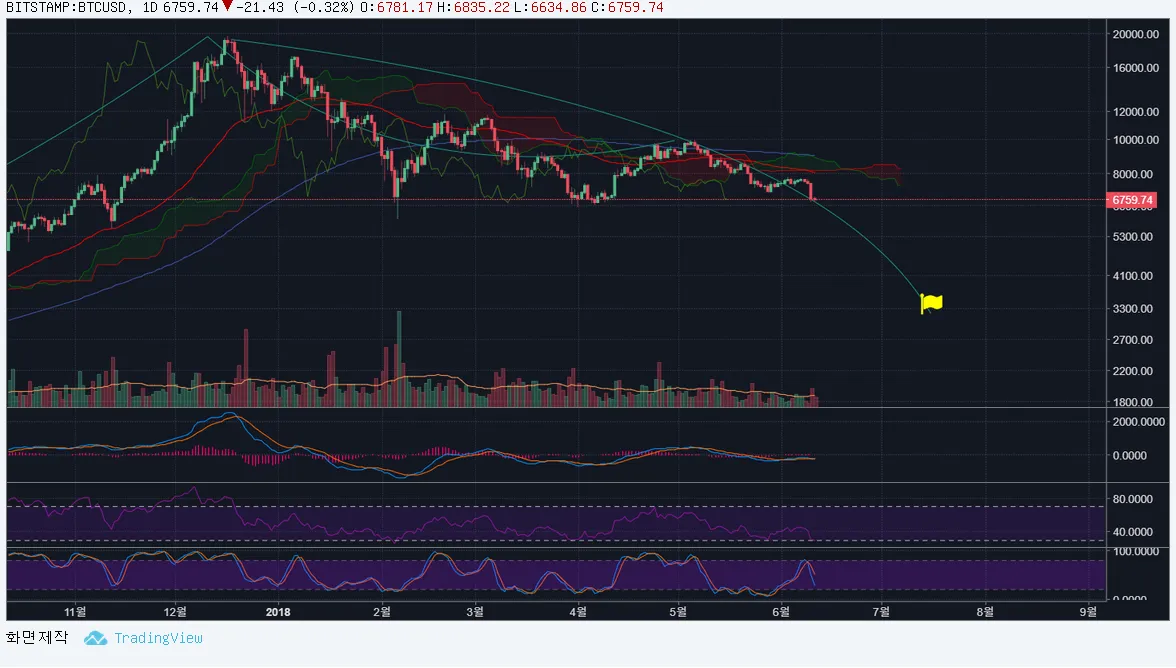
Daily chart (일봉)

This time the green line is acting as support.
일봉에서는 초록선이 지지선 역할을 하고 있습니다.
But if bitcoin price collapse under this line, price falling will be accelerated.
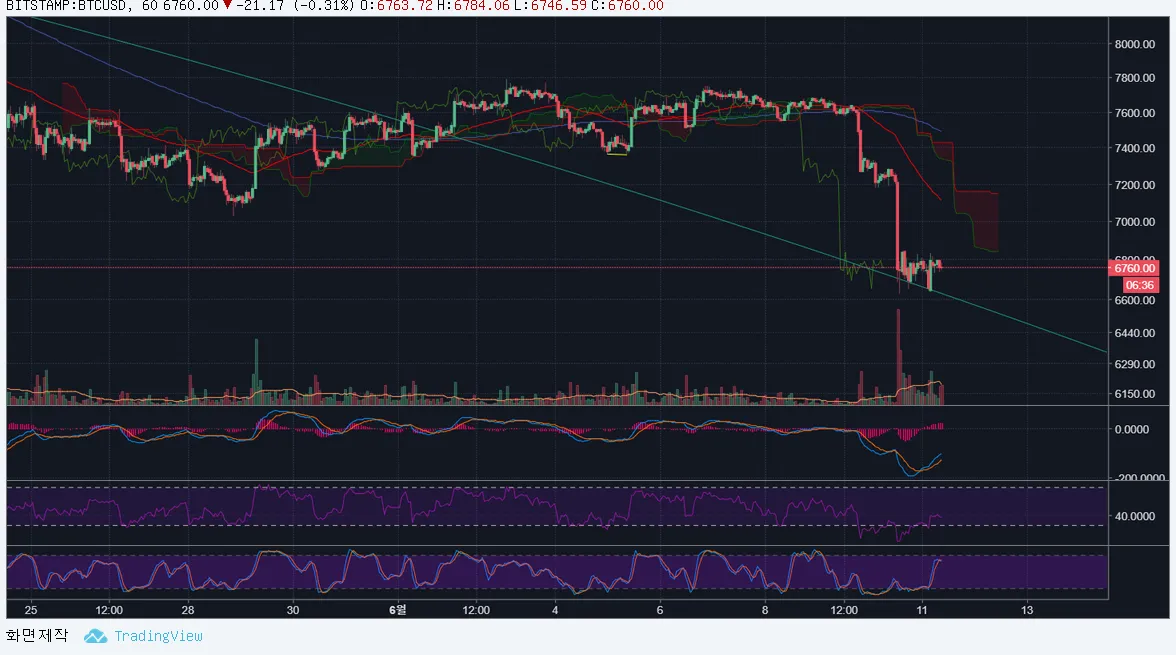
비트코인가격이 이선 밑으로 떨어지면 가격하락은 가속화 될 것입니다.1 hour chart (1시간봉)

The situation seems similiar as daily chart.
1시간 봉의 상황은 일봉과 비슷해보입니다.
We should watch if the price will pass the line or not.
가격이 선을 통과하는지 안하는지 지켜봐야합니다.
Thanks.
감사합니다.
This note is not a financial advice.
이 노트는 파이낸셜 어드바이스가 아닙니다.
모든 책임은 투자자 본인에게 있습니다.