
In this editorial, I am going to explain my analysis and the reason why I think Bitcoin is going to 3000$.
This was my Elliott Wave analysis from 2. of July and Is already going in accordance with the projection.

As you can see the last corrective wave Z has ended on the upside which means that more downside could be expected from here to the first target at 4700$ which is where the next significant support level is.
However, in this editorial, I want to discuss a possibility of another scenario in which the price of Bitcoin can go up to 12000$ before it completely crashes.
Alternative scenario
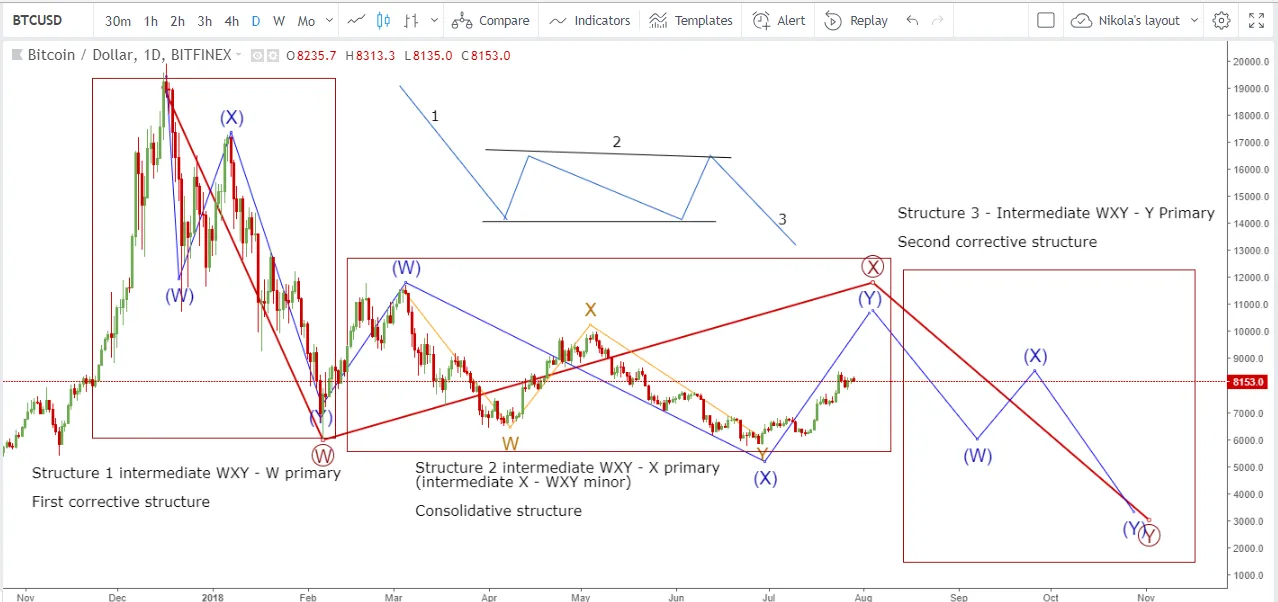
The first structure should be viewed as one whole and not be mixed with the second one. The second structure can be either a WXYXZ (my primary count) or another intermediate WXY in which another minor WXY is incorporated (alternative count).
Current wave high will determine the validity of my count - if the price decreases from here then my WXYXZ count is in play, and if it increased (up to 12000$ max which is the high from the second intermediate W wave) then the alternative count is in play.
In both scenarios, I am expecting the price of Bitcoin to go significantly lower as Structure 3 will occur as a trend continuation after some period of consolidation.
2014 correction
Similar correction happened in 2014 and I have labeled the equivalent prices to the current once.

The price of Bitcoin retraced back to the levels from which the all-time high was made as the wave Y ended which would today be 3000$ or less to 2700$.
Conclusion
Bitcoin already experienced these crashes 4 times, and every time it did the scenario was similar - a bubble formed and after the pop, the price retraced back to the levels from which the new all-time high was made increasing a plateau every time. The reason why I wanted to post this analysis is to spread awareness of the potential scenario in which the price goes high enough that the market participants get tricked into thinking the correction is over. Many did think and called an increase of Bitcoins price from 5800$ to 8200$ 'the start of the bull market'.
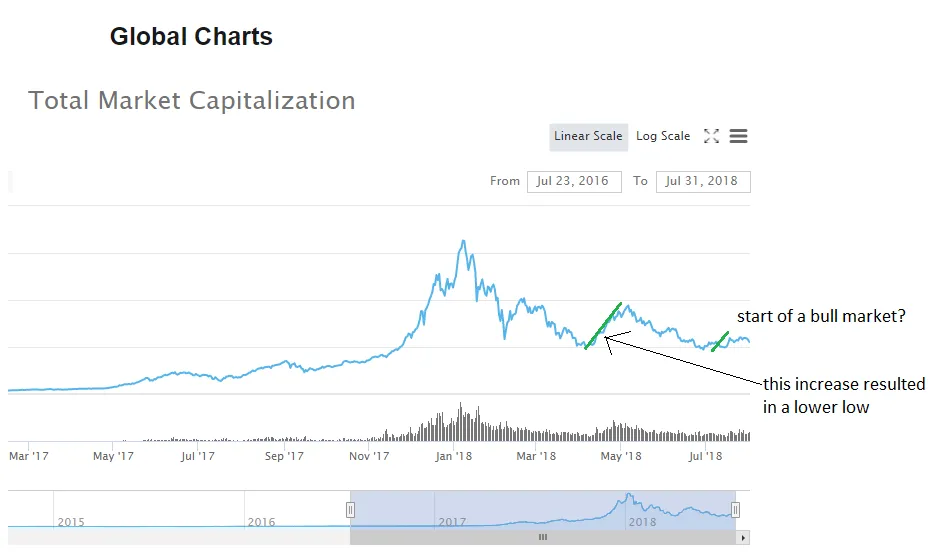
While we are looking at the global chart of the market cap evaluation, this is what I have projected in June:
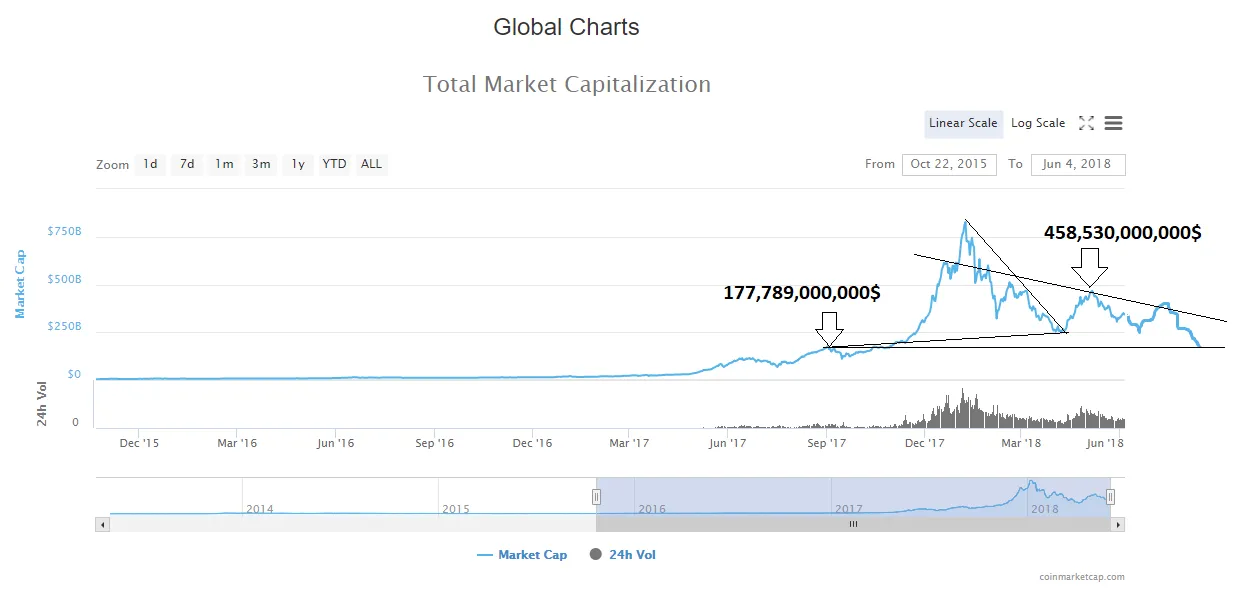
As you can see I was expecting the evaluation to decline from there to the levels of the prior low, from where it will recover to the levels below the prior high around $350B in evaluation which would be a lower high in this downtrend. That is exactly what happened.
This would also correspond with the market cap graph from 2014 correction in which the evaluation halved from the last recovery to the lowest point which is what I would be expecting now.

Bitcoin has more room for growth which is why more upside from here wouldn't surprise me, but in both scenarios, the direction is down. The second scenario is providing more upside but consequently more downside after. So the only thing I can't figure out yet is will Bitcoins price continue this uptrend for a bit more or was this it?
