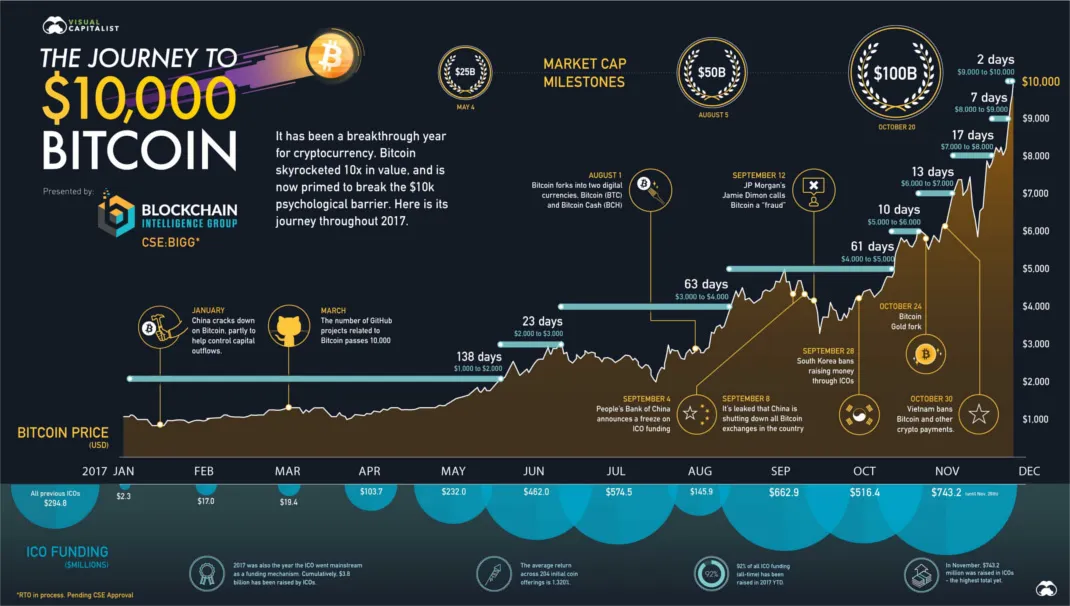
I have come across this visualized chart where it shows Bitcoin's run to 10,000$ and it states some important stats. Link: http://www.visualcapitalist.com/visualizing-journey-10000-bitcoin/
EVENTS
"January 2, 2017, Bitcoin closes above the $1k mark for first time in 1,124 days
Mid-January 2017, China cracks down on crypto, partly to help control capital outflows
March 2017, The number of GitHub projects related to Bitcoin passes 10,000
May 4, 2017, Bitcoin surpasses $25B in market capitalization
August 1, 2017, Bitcoin forks into two digital currencies, Bitcoin (BTC) and Bitcoin Cash (BCH)
August 5, 2017, Bitcoin surpasses $50B in market capitalization
September 4, 2017, People’s Bank of China announces that it’s implementing a freeze on ICO funding.
September 8, 2017, It’s leaked that China is shutting down all Bitcoin exchanges in the country
September 12, 2017, JP Morgan’s Jamie Dimon calls Bitcoin a “fraud”
September 28, 2017, South Korea bans raising money through ICOs
October 20, 2017, Bitcoin passes $100B in market capitalization
October 24, 2017, Bitcoin again forks into two digital currencies, Bitcoin (BTC) and Bitcoin Gold (BTG)
October 30, 2017, Vietnam bans Bitcoin and other crypto payments
November 26, 2017, Bitcoin passes $150B in market capitalization
November 28, 2017, Bitcoin trades at $10k for the first time.
138 days Jan 2, 2017 -> May 20, 2017 $1,000 to $2,000
23 days May 20, 2017 -> June 11, 2017 $2,000 to $3,000
63 days June 11, 2017 -> Aug 13, 2017$3,000 to $4,000
61 days Aug 13, 2017 -> Oct 12, 2017$4,000 to $5,000
10 days Oct 12, 2017 -> Oct 21, 2017$5,000 to $6,000
13 days Oct 21, 2017 -> Nov 2, 2017$6,000 to $7,000
17 days Nov 2, 2017 -> Nov 19, 2017$7,000 to $8,000
7 days Nov 19, 2017 -> Nov 26, 2017$8,000 to $9,000
2 days Nov 26, 2017 -> Nov 28, 2017$9,000 to $10,000"
This is a reminder that how fast BTC can move upwards. We all know bear market lasts longer than the bull market. In the long term, we set higher highs and higher lows.
The info is taken from: http://www.visualcapitalist.com/visualizing-journey-10000-bitcoin/