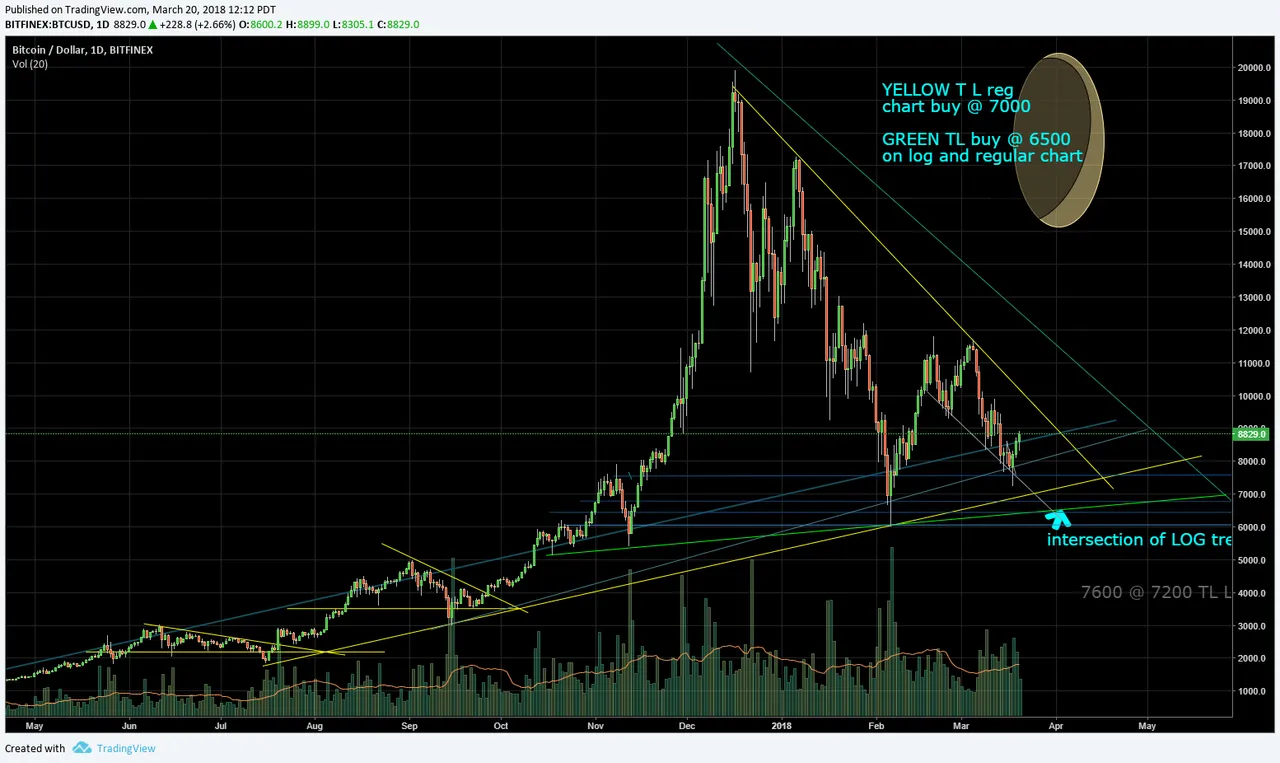
In the above image you can easily see the triangles demarcated by the yellow and grey trend lines on the non log chart. Pay attention to those lines that touch on the candles and candle wicks.
We may be waiting for some time to see a definitive breakout so we have a better understanding of which way this market is going in the medium term future.
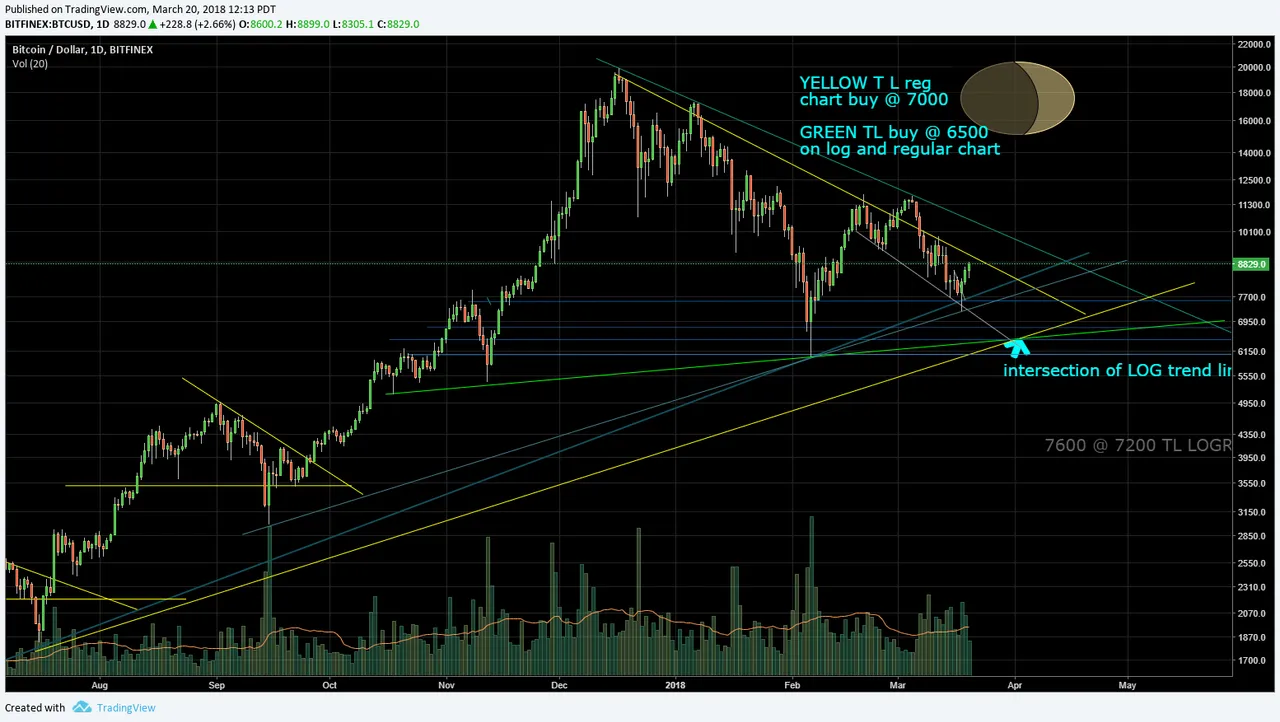
The second chart is logarithmic and again sees BTC locked in a triangle pattern that we are waiting to see resolved. The true confirmation of a new trend will occur when both the logrithmic and non logrithmic charts price moves outside of the triangle formations.
Which way do you think it is going? Are you like me waiting for one more big dip to grab some more bargains? Thank you again for reading, following and contributing.
As always this is not investment advice, I am not a financial adviser. Do your own research.